Targa Resources Corp. WCA - Ascending TriangleCompany: Targa Resources Corp.
Ticker: TRGP
Exchange: NYSE
Sector: Energy
Introduction:
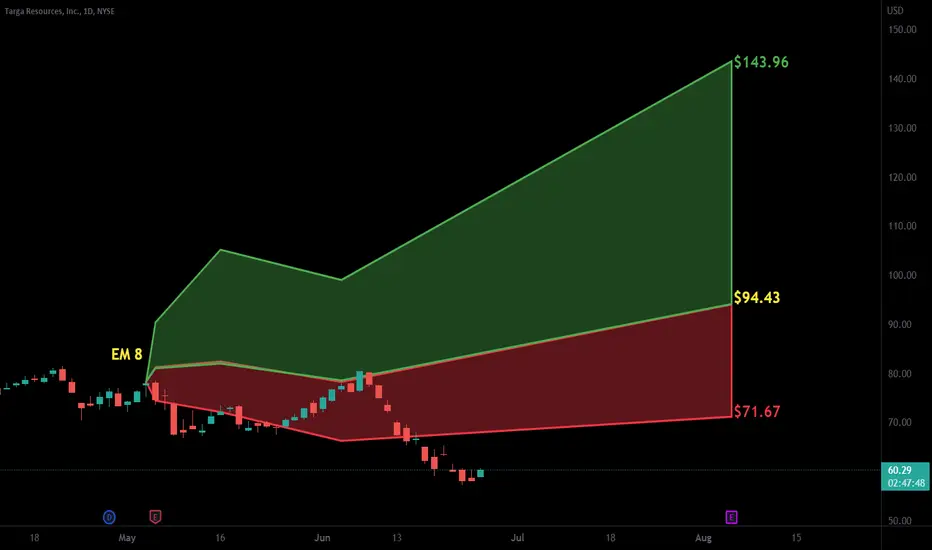
In today's examination, we focus on Targa Resources Corp. (TRGP) listed on the NYSE, a key player in the energy sector. The weekly chart exhibits a bullish breakout from an Ascending Triangle pattern, which h
3.34EUR
750.36 MEUR
14.15 BEUR
218.12 M
About TARGA RESOURCES INVESTMENTS INC.
Sector
Industry
CEO
Matthew J. Meloy
Website
Headquarters
Houston
Employees (FY)
3.18 K
Founded
2005
ISIN
US87612G1013
FIGI
BBG001B57J40
Targa Resources Corp. provides midstream natural gas and natural gas liquids services. It also provides gathering, storing, and terminaling crude oil, and storing, terminaling, and selling refined petroleum products. It operates through the Gathering and Processing and Logistics and Transportation segments. The Gathering and Processing segment includes assets used in the gathering of natural gas produced from oil and gas wells and processing this raw natural gas into merchantable natural gas by extracting NGLs and removing impurities, and assets used for crude oil gathering and terminaling. The Logistics and Transportation segment focuses on the activities necessary to convert mixed NGLs into NGL products and provides certain value-added services such as the storing, fractionating, terminaling, transporting and marketing of NGLs and NGL products, including services to LPG exporters, and the storing and terminaling of refined petroleum products and crude oil and certain natural gas supply and marketing activities in support of its other businesses. The company was founded in October 2005 and is headquartered in Houston, TX.

$TRGP with a Bullish outlook following its earnings #Stocks The PEAD projected a Bullish outlook for $TRGP after a Positive Under reaction following its earnings release placing the stock in drift A with an expected accuracy of 71.43%.

TRGP - Weekly TopRed horizontal is a top forming
Price is still above a larger down channel, price will likely bounce off this downtrend line once retested, this is shown with the double curve

Targa Resources Corp. Reports Second Quarter 2022TRGP: Targa Resources Corp.
2022-08-04 06:00:00 Targa Resources Corp. Reports Second Quarter 2022 Financial Results and Increases Full Year 2022 Financial Outlook

$TRGP with a Bullish outlook following its earnings #Stocks The PEAD projected a Bullish outlook for $TRGP after a Negative over reaction following its earnings release placing the stock in drift C with an expected accuracy of 100%.

US Stock In Play: $TRGP$TRGP in midst of a setup (cup and handle) within its uptrend line supporting since jan'21. do note bigger cap oil & gas names (eg. $CNQ, $CVE, $DVN, $PXD) have earlier ran much ahead of their 52wks high in early January.
earnings on 24th feb pre-market


Targa Resources Corp. Reports Second Quarter 2021 Financial ResuTRGP: Targa Resources Corp.
2021-08-05 06:00:00
Targa Resources Corp. Reports Second Quarter 2021 Financial Results and Increases 2021 Financial Outlook


See all ideas
Trade directly on the supercharts through our supported, fully-verified and user-reviewed brokers.


Curated watchlists where TAR is featured.

Frequently Asked Questions
The current price of TAR is 105.90 EUR — it has increased by 1.19% in the past 24 hours.
Depending on the exchange, the stock ticker may vary. For instance, on SWB exchange TARGA RESOURCES INVESTMENTS INC. stocks are traded under the ticker TAR.
TARGA RESOURCES INVESTMENTS INC. is going to release the next earnings report on May 2, 2024. Keep track of upcoming events with our Earnings Calendar.
TAR stock is 1.68% volatile and has beta coefficient of 0.53. Check out the list of the most volatile stocks — is TARGA RESOURCES INVESTMENTS INC. there?
One year price forecast for TARGA RESOURCES INVESTMENTS INC. has a max estimate of 125.74 EUR and a min estimate of 89.02 EUR.
TAR earnings for the last quarter are 0.93 EUR per share, whereas the estimation was 1.13 EUR resulting in a −17.95% surprise. The estimated earnings for the next quarter are 1.32 EUR per share. See more details about TARGA RESOURCES INVESTMENTS INC. earnings.
TARGA RESOURCES INVESTMENTS INC. revenue for the last quarter amounts to 3.69 B EUR despite the estimated figure of 4.30 B EUR. In the next quarter revenue is expected to reach 3.49 B EUR.
Yes, you can track TARGA RESOURCES INVESTMENTS INC. financials in yearly and quarterly reports right on TradingView.
TAR stock has fallen by 1.30% compared to the previous week, the month change is a 5.69% rise, over the last year TARGA RESOURCES INVESTMENTS INC. has showed a 52.59% increase.
TAR net income for the last quarter is 251.60 M EUR, while the quarter before that showed 206.04 M EUR of net income which accounts for 22.11% change. Track more TARGA RESOURCES INVESTMENTS INC. financial stats to get the full picture.
Today TARGA RESOURCES INVESTMENTS INC. has the market capitalization of 23.37 B, it has increased by 0.95% over the last week.
Yes, TAR dividends are paid quarterly. The last dividend per share was 0.46 EUR. As of today, Dividend Yield (TTM)% is 1.79%. Tracking TARGA RESOURCES INVESTMENTS INC. dividends might help you take more informed decisions.
TARGA RESOURCES INVESTMENTS INC. dividend yield was 2.13% in 2023, and payout ratio reached 50.48%. The year before the numbers were 1.90% and 36.08% correspondingly. See high-dividend stocks and find more opportunities for your portfolio.
Like other stocks, TAR shares are traded on stock exchanges, e.g. Nasdaq, Nyse, Euronext, and the easiest way to buy them is through an online stock broker. To do this, you need to open an account and follow a broker's procedures, then start trading. You can trade TARGA RESOURCES INVESTMENTS INC. stock right from TradingView charts — choose your broker and connect to your account.
As of Apr 20, 2024, the company has 3.18 K employees. See our rating of the largest employees — is TARGA RESOURCES INVESTMENTS INC. on this list?
Investing in stocks requires a comprehensive research: you should carefully study all the available data, e.g. company's financials, related news, and its technical analysis. So TARGA RESOURCES INVESTMENTS INC. technincal analysis shows the buy rating today, and its 1 week rating is buy. Since market conditions are prone to changes, it's worth looking a bit further into the future — according to the 1 month rating TARGA RESOURCES INVESTMENTS INC. stock shows the buy signal. See more of TARGA RESOURCES INVESTMENTS INC. technicals for a more comprehensive analysis.
If you're still not sure, try looking for inspiration in our curated watchlists.
If you're still not sure, try looking for inspiration in our curated watchlists.
We've gathered analysts' opinions on TARGA RESOURCES INVESTMENTS INC. future price: according to them, TAR price has a max estimate of 125.73 EUR and a min estimate of 89.02 EUR. Read a more detailed TARGA RESOURCES INVESTMENTS INC. forecast: see what analysts think of TARGA RESOURCES INVESTMENTS INC. and suggest that you do with its stocks.
EBITDA measures a company's operating performance, its growth signifies an improvement in the efficiency of a company. TARGA RESOURCES INVESTMENTS INC. EBITDA is 3.19 B EUR, and current EBITDA margin is 22.55%. See more stats in TARGA RESOURCES INVESTMENTS INC. financial statements.