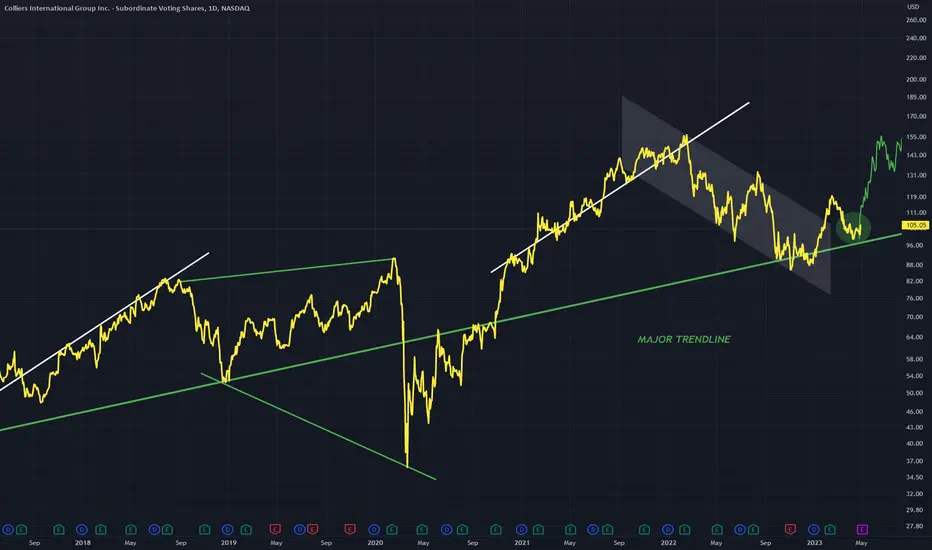
CIGI - Major Trend Line BottomFinding its bottom along a major trend line
This correlates well with previous bottoms with 2020 being an anomaly.
I expect support to be found and continuation to occur.
1.24EUR
60.47 MEUR
4.00 BEUR
40.28 M
About COLLIERS INTERNATIONAL GROUP INC.
Sector
Industry
CEO
Jay S. Hennick
Website
Headquarters
Toronto
Founded
1988
ISIN
CA1946931070
FIGI
BBG000BP58M4
Colliers International Group, Inc. engages in the provision of commercial real estate services to corporate and institutional clients. It offers outsourcing and advisory services, lease brokerage, and sales brokerage. It operates through the following segments: Americas, EMEA, Asia Pacific, Investment Management, and Corporate. The Corporate segment includes the costs of global administrative functions and corporate head office. The company was founded on July 31, 1988, and is headquartered in Toronto, Canada.
Price action gameWith this action the price can make good perfermence.it s true if the big scann the movement the price fly

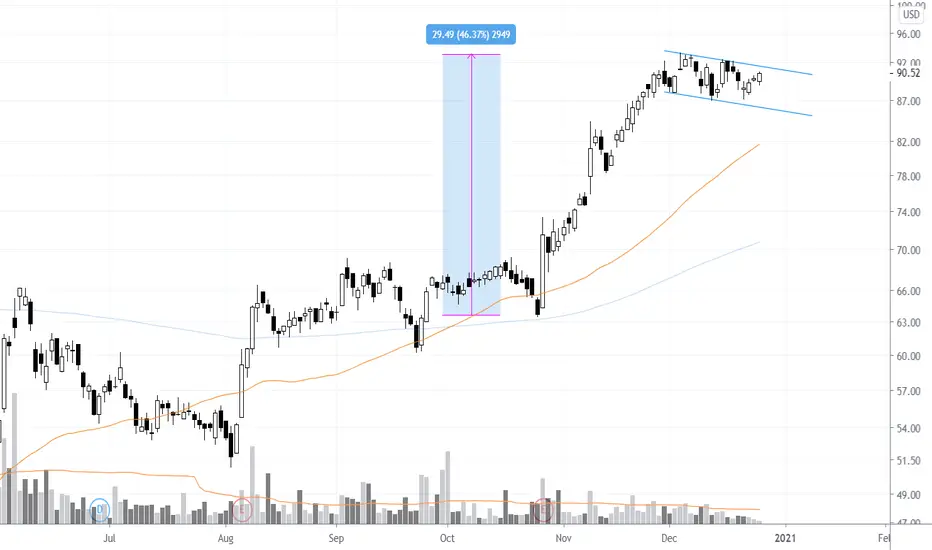
$CIGI #BullFlag SetupText book bull flag pull back on low volume after a 46% rally since late October. A close about the flag upper boundary could potentially signal the resumption of the upward trend.

See all ideas
Trade directly on the supercharts through our supported, fully-verified and user-reviewed brokers.


Frequently Asked Questions
Depending on the exchange, the stock ticker may vary. For instance, on SWB exchange COLLIERS INTERNATIONAL GROUP INC. stocks are traded under the ticker FSV.
COLLIERS INTERNATIONAL GROUP INC. is going to release the next earnings report on May 2, 2024. Keep track of upcoming events with our Earnings Calendar.
One year price forecast for COLLIERS INTERNATIONAL GROUP INC. has a max estimate of 137.76 EUR and a min estimate of 115.06 EUR.
FSV earnings for the last quarter are 1.14 EUR per share, whereas the estimation was 1.56 EUR resulting in a −26.92% surprise. The estimated earnings for the next quarter are 1.79 EUR per share. See more details about COLLIERS INTERNATIONAL GROUP INC. earnings.
COLLIERS INTERNATIONAL GROUP INC. revenue for the last quarter amounts to 1.01 B EUR despite the estimated figure of 1.02 B EUR. In the next quarter revenue is expected to reach 1.14 B EUR.
Yes, you can track COLLIERS INTERNATIONAL GROUP INC. financials in yearly and quarterly reports right on TradingView.
FSV net income for the last quarter is 62.78 M EUR, while the quarter before that showed 23.46 M EUR of net income which accounts for 167.68% change. Track more COLLIERS INTERNATIONAL GROUP INC. financial stats to get the full picture.
Yes, FSV dividends are paid semi-annually. The last dividend per share was 0.14 EUR. As of today, Dividend Yield (TTM)% is 0.27%. Tracking COLLIERS INTERNATIONAL GROUP INC. dividends might help you take more informed decisions.
COLLIERS INTERNATIONAL GROUP INC. dividend yield was 0.24% in 2023, and payout ratio reached 20.84%. The year before the numbers were 0.32% and 28.93% correspondingly. See high-dividend stocks and find more opportunities for your portfolio.
Like other stocks, FSV shares are traded on stock exchanges, e.g. Nasdaq, Nyse, Euronext, and the easiest way to buy them is through an online stock broker. To do this, you need to open an account and follow a broker's procedures, then start trading. You can trade COLLIERS INTERNATIONAL GROUP INC. stock right from TradingView charts — choose your broker and connect to your account.
We've gathered analysts' opinions on COLLIERS INTERNATIONAL GROUP INC. future price: according to them, FSV price has a max estimate of 137.75 EUR and a min estimate of 115.07 EUR. Read a more detailed COLLIERS INTERNATIONAL GROUP INC. forecast: see what analysts think of COLLIERS INTERNATIONAL GROUP INC. and suggest that you do with its stocks.
EBITDA measures a company's operating performance, its growth signifies an improvement in the efficiency of a company. COLLIERS INTERNATIONAL GROUP INC. EBITDA is 510.33 M EUR, and current EBITDA margin is 12.75%. See more stats in COLLIERS INTERNATIONAL GROUP INC. financial statements.