CASY Casey's General Stores Options Ahead of EarningsAnalyzing the options chain and the chart patterns of CASY Casey's General Stores prior to the earnings report this week,
I would consider purchasing the 260usd strike price Calls with
an expiration date of 2023-10-20,
for a premium of approximately $2.02.
If these options prove to be profitable pri
11.70EUR
405.55 MEUR
13.70 BEUR
36.84 M
About CASEY'S GENERAL STORES INC.
Sector
Industry
CEO
Darren M. Rebelez
Website
Headquarters
Ankeny
Employees (FY)
42.98 K
Founded
1959
ISIN
US1475281036
FIGI
BBG000GLP8Z2
Casey's General Stores, Inc. engages in the management and operation of convenience stores and gasoline stations. It provides self-service gasoline, a wide selection of grocery items, and an array of freshly prepared food items. The firm offers food, beverages, tobacco products, health and beauty aids, automotive products, and other non-food items. The company was founded by Donald F. Lamberti in 1968 and is headquartered in Ankeny, IA.

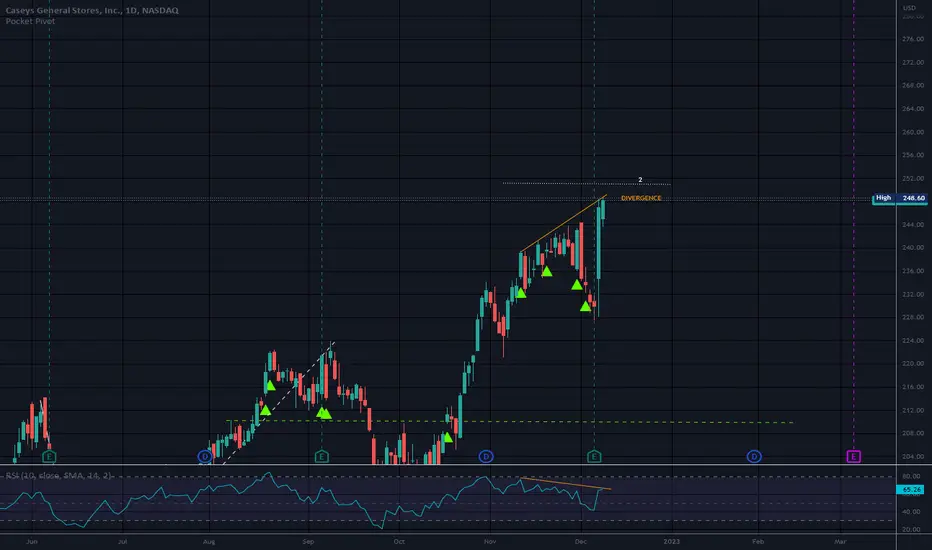
Earnings Beat/DivergenceRSI does not match price movement.
This divergence will eventually correct.
No recommendation.
CASYAnother overbloated retail stock that needs to go back to preCOVID levels.
Just one put contract for earnings, a kicks and giggles bet. Gasoline prices are gonna impact store sales.

CASY gonna grab it before earningslooks like this one could make a little in gains earnings comming out on the 8th the past 11 days have green bars on volume and we are sitting several clicks above the 50MA.the tecnical indicators are showing strong buy through the next week.
the past four earnings reports are all beats lets keep ou

CASYSystem T Performances: Annual Compound Profit 40%, Win Rate 55%, Risk/Reward Ratio 1:2, 20 Years of Backtesting Data, Over 100 Markets.
* Click Like and Follow to Support My Work!
---
Hi Traders,
I'd like to introduce the System T, a computerized trading system that analyzed and backtested the 2

CASY- Pizza join/convenience storeOverbought on RSI. Stoch looking to potentially give us the heads up on a downturn in the next day or 2. There's NO accumulation going on. Fat tail looking to give it all back. MACD Strong as can be, but the rest of the indicators lead me to believe this will be a decent short. It's only up on a gol

CASY. Double top.Double top pattern. Sell @ $125-135, TP $100-105, SL above $140. avg. volume is less than 1M, so there might be some problems if u are going to short 1000+ shares. this idea is not so perfect, cuz uptrend is still going. so I hope that the price reached it's top and will continue to stay in range $1

$CASY Day Trade Parabolic Potential on Good News $CASY has gone parabolic premarket on good earnings. Its at $147 premarket, the all time highs on the daily is $138. This is going be very volatile, but if it gets good volume (at least 500,000 shares in first 5 minutes on market open) then I would go Long on it after, and only after a Pullback. I w

$CASY MAJOR CHANGES AT CASEY'S STORES, BREAKOUT POTENTIAL There has been a lot of very positive changes at NASDAQ:CASY in the past few weeks, the updated digital store and online ordering system now offers easier ordering, more customisation and faster carryout which is hoped to improve efficiency and boost sales. More recently Casey's have appointed for

CASY - SHORTShort based on 50% fib retracement and candlestick pattern. Friday is a sell day usually, maybe a pop and drop or just a drop? tomorrow am. $131.74 is stop.TGIF.

See all ideas
Trade directly on the supercharts through our supported, fully-verified and user-reviewed brokers.


Frequently Asked Questions
The current price of CS2 is 290.00 EUR — it has increased by 0.69% in the past 24 hours.
Depending on the exchange, the stock ticker may vary. For instance, on SWB exchange CASEY'S GENERAL STORES INC. stocks are traded under the ticker CS2.
CASEY'S GENERAL STORES INC. is going to release the next earnings report on Jun 10, 2024. Keep track of upcoming events with our Earnings Calendar.
CS2 stock is 0.69% volatile and has beta coefficient of 0.27. Check out the list of the most volatile stocks — is CASEY'S GENERAL STORES INC. there?
One year price forecast for CASEY'S GENERAL STORES INC. has a max estimate of 326.90 EUR and a min estimate of 257.85 EUR.
CS2 earnings for the last quarter are 4.01 EUR whereas the estimation was 3.60 EUR which accounts for 11.45% surprise. Estimated earnings for the next quarter are 1.98 EUR. See more details about CASEY'S GENERAL STORES INC. earnings.
CASEY'S GENERAL STORES INC. revenue for the last quarter amounts to 3.84 B EUR despite the estimated figure of 3.84 B EUR. In the next quarter revenue is expected to reach 3.23 B EUR.
Yes, you can track CASEY'S GENERAL STORES INC. financials in yearly and quarterly reports right on TradingView.
CS2 stock hasn't changed in a week, the month change is a 3.57% rise, over the last year CASEY'S GENERAL STORES INC. has showed a 40.78% increase.
CS2 net income for the last quarter is 80.37 M EUR, while the quarter before that showed 150.18 M EUR of net income which accounts for −46.49% change. Track more CASEY'S GENERAL STORES INC. financial stats to get the full picture.
Today CASEY'S GENERAL STORES INC. has the market capitalization of 10.72 B, it has decreased by 0.57% over the last week.
Yes, CS2 dividends are paid quarterly. The last dividend per share was 0.40 EUR. As of today, Dividend Yield (TTM)% is 0.54%. Tracking CASEY'S GENERAL STORES INC. dividends might help you take more informed decisions.
CASEY'S GENERAL STORES INC. dividend yield was 0.66% in 2022, and payout ratio reached 12.77%. The year before the numbers were 0.69% and 15.28% correspondingly. See high-dividend stocks and find more opportunities for your portfolio.
Like other stocks, CS2 shares are traded on stock exchanges, e.g. Nasdaq, Nyse, Euronext, and the easiest way to buy them is through an online stock broker. To do this, you need to open an account and follow a broker's procedures, then start trading. You can trade CASEY'S GENERAL STORES INC. stock right from TradingView charts — choose your broker and connect to your account.
As of Apr 19, 2024, the company has 42.98 K employees. See our rating of the largest employees — is CASEY'S GENERAL STORES INC. on this list?
Investing in stocks requires a comprehensive research: you should carefully study all the available data, e.g. company's financials, related news, and its technical analysis. So CASEY'S GENERAL STORES INC. technincal analysis shows the buy rating today, and its 1 week rating is buy. Since market conditions are prone to changes, it's worth looking a bit further into the future — according to the 1 month rating CASEY'S GENERAL STORES INC. stock shows the buy signal. See more of CASEY'S GENERAL STORES INC. technicals for a more comprehensive analysis.
If you're still not sure, try looking for inspiration in our curated watchlists.
If you're still not sure, try looking for inspiration in our curated watchlists.
We've gathered analysts' opinions on CASEY'S GENERAL STORES INC. future price: according to them, CS2 price has a max estimate of 326.91 EUR and a min estimate of 257.84 EUR. Read a more detailed CASEY'S GENERAL STORES INC. forecast: see what analysts think of CASEY'S GENERAL STORES INC. and suggest that you do with its stocks.
EBITDA measures a company's operating performance, its growth signifies an improvement in the efficiency of a company. CASEY'S GENERAL STORES INC. EBITDA is 932.04 M EUR, and current EBITDA margin is 6.33%. See more stats in CASEY'S GENERAL STORES INC. financial statements.