Finer Market Points: ASX Top 10 Momentum Stocks: 10 Apr 2024GETTEX:M4M NYSE:MSB ASX:NXM ASX:AIS NYSE:MMC ASX:WR1 ASX:QOR CSEMA:SBM GETTEX:CBE NYSE:FND
Momentum leading shares are the market's best performers today. They are the fastest-growing shares on the ASX over the last 90 days. These companies can't get to be leaders without first a
−299.14 MEUR
197.74 MEUR
789.27 M
About ST. BARBARA LTD.
Sector
Industry
CEO
Andrew Strelein
Website
Headquarters
Perth
Employees (FY)
1.34 K
Founded
1969
ISIN
AU000000SBM8
FIGI
BBG000DJ63V6
St. Barbara Ltd. engages in the development and exploration of gold and mineral properties. It operates through the Simberi and Atlantic geographical segments. The company was founded on May 15, 1969 and is headquartered in Perth, Australia.

$SBM 0.190 GOLD MC $145m cash at hand $236MHow this has stayed down for so long is pretty impressive, big boys play HARD
Cash balance of $236 million as at 30 September 2023 (0.30 ps)
Sure theyve had/got issues BUT they got cash money too
770m SOI
Aside from the funnymentals
Chart looks ready for a leg up with target at 30, nice lil gai

SBM - ASX Gold MinerPrice resting on macro swing low.
RSI at lows of 30
Long towards $1 = TP
$5 macro target.
Gold ATH in AUD


buy SBM @ the lower boundSBM looks bad. sentiment is bad.
price is bad. buy the support level which is close.
10-20 cents is a good buying area. speculate on this on
and hope it doesnt end up like BDR, TRY or X64.
we need the gold price to move higher to lift
all these gold miners. when the price of gold rockets
higher


SBM price @ supportthe 2 week chart shows
price @ long term support level.
see the yellow trend line.
expect some strong buying to coming into SBM
in the coming weeks.
i will take a punt and buy a small parcel
of SBM

SBM could be bottoming at these levels looking for a bounce.$SBM St Barbara pretty much following #gold, but could bounce from these levels. Relatively low PE, Price/Asset, 4%+ ff div. Substantial holders recently accumulating. Qtr coming up. $1.78 currently $sbm.ax

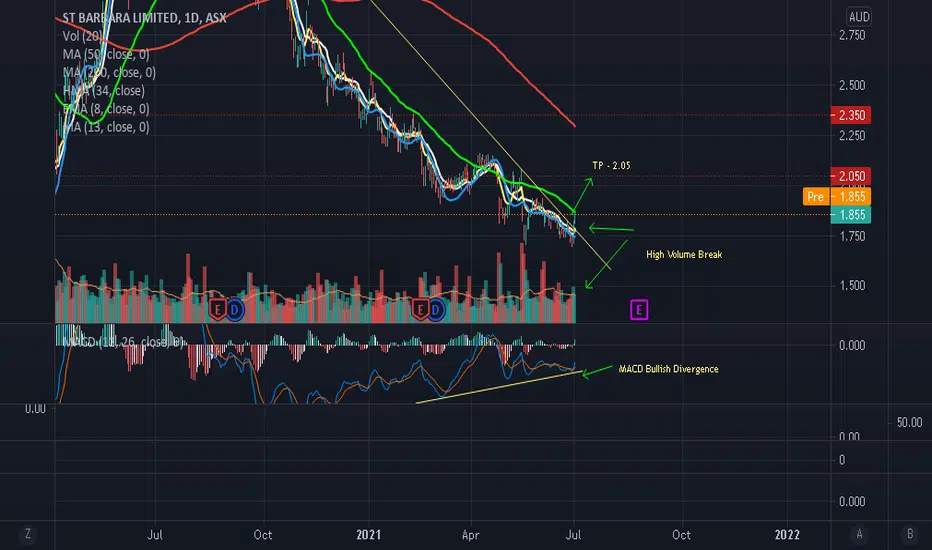
SBM - Trade PlanSBM has broken out of it downtrend line with High Volume indicating a possible change in trend. There is also MACD Bullish Divergence indicating a change in momentum. This shows that the risk to reward is on the upside. My plan is to target the initial resistance level of $2.05 (potential 10% gain)
SBM at beginning of new bull phaseAfter the recent sell-off, we can see that SBM bounced strongly off the 200MA. Couple this with gold entering a multi-year bull market and $3 is looking cheap.

See all ideas
Trade directly on the supercharts through our supported, fully-verified and user-reviewed brokers.


Frequently Asked Questions
Depending on the exchange, the stock ticker may vary. For instance, on SWB exchange ST. BARBARA LTD. stocks are traded under the ticker BM1.
ST. BARBARA LTD. is going to release the next earnings report on Aug 21, 2024. Keep track of upcoming events with our Earnings Calendar.
One year price forecast for ST. BARBARA LTD. has a max estimate of 0.1701 EUR and a min estimate of 0.0547 EUR.
BM1 earnings for the last quarter are 0.01 EUR per share, whereas the estimation was 0.00 EUR resulting in a 587.54% surprise. The estimated earnings for the next quarter are 0.03 EUR per share. See more details about ST. BARBARA LTD. earnings.
ST. BARBARA LTD. revenue for the last quarter amounts to 206.94 M EUR despite the estimated figure of 208.83 M EUR. In the next quarter revenue is expected to reach 200.46 M EUR.
Yes, you can track ST. BARBARA LTD. financials in yearly and quarterly reports right on TradingView.
BM1 net income for the last quarter is −26.32 M EUR, while the quarter before that showed −259.19 M EUR of net income which accounts for 89.85% change. Track more ST. BARBARA LTD. financial stats to get the full picture.
Like other stocks, BM1 shares are traded on stock exchanges, e.g. Nasdaq, Nyse, Euronext, and the easiest way to buy them is through an online stock broker. To do this, you need to open an account and follow a broker's procedures, then start trading. You can trade ST. BARBARA LTD. stock right from TradingView charts — choose your broker and connect to your account.
As of Apr 23, 2024, the company has 1.34 K employees. See our rating of the largest employees — is ST. BARBARA LTD. on this list?
We've gathered analysts' opinions on ST. BARBARA LTD. future price: according to them, BM1 price has a max estimate of 0.17 EUR and a min estimate of 0.05 EUR. Read a more detailed ST. BARBARA LTD. forecast: see what analysts think of ST. BARBARA LTD. and suggest that you do with its stocks.