FME • Fresenius Medical Care • LONG#FME • Fresenius Medical Care • XETRA LONG TF H4
TP = 45.35 , SL = 39.59
The trend continues, the nearest support level according to my calculations TP 45.35
1.70EUR
499.00 MEUR
19.45 BEUR
199.03 M
About FRESENIUS MEDICAL C
Sector
Industry
CEO
Helen Giza
Website
Headquarters
Bad Homburg
Employees (FY)
119.85 K
Founded
2006
ISIN
DE0005785802
FIGI
BBG008P7G010
Fresenius Medical Care AG engages in the provision of products and services for individuals with renal diseases. It operates through the Care Enablement and Care Delivery segments. The Care Enablement segment is involved in the healthcare products business including research and development, manufacturing, supply chain, and commercial operations as well as supporting functions, such as regulatory and quality management. The Care Delivery segment focuses on the health care services for the treatment of CKD, ESRD, and other extracorporeal therapies, including value and risk-based care programs. The company was founded on August 5, 1996 and is headquartered in Bad Homburg, Germany.

ABC/DTarget is D.
Possible stop under C.
I own this and it is a slow but a steady mover.
I scooped this up very close to the bottom and have not been disappointed.
Not yet anyway LOL.
The market has a way of biting me when I least expect it but I plan to hang.
No recommendation.
ATH 57.94
EARNINGS 8-2/

Cup and HandleResistance overhead from a prior gap down. OVERBOUGHT using standard RSI set at 70.
Cup low is 12.79.
Earnings 5-9-23.
This company is in Germany and provides dialysis to kidney failure patients. There are clinics al over the US owned by this company providing a service that kidney failure pati

Bottom FishingAscending Triangle.
ATL is 3.35.
3 year low is 12.79 which was made recently.
ATH 57.94.
Another dialysis company that is not based in the USA, so as a rule there would be no dividend.
Dialysis is not going away unfortunately and these dialysis sessions 3 times a week will always be covered as far

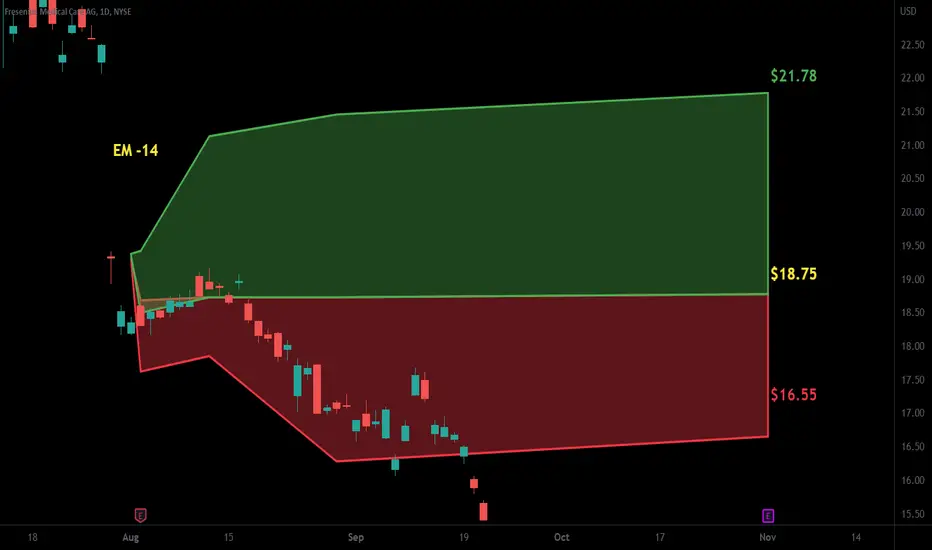
$FMS with a Bearish outlook following its earnings #Stocks The PEAD projected a Bearish outlook for $FMS after a Negative Under reaction following its earnings release placing the stock in drift D with an expected accuracy of 33.33%.
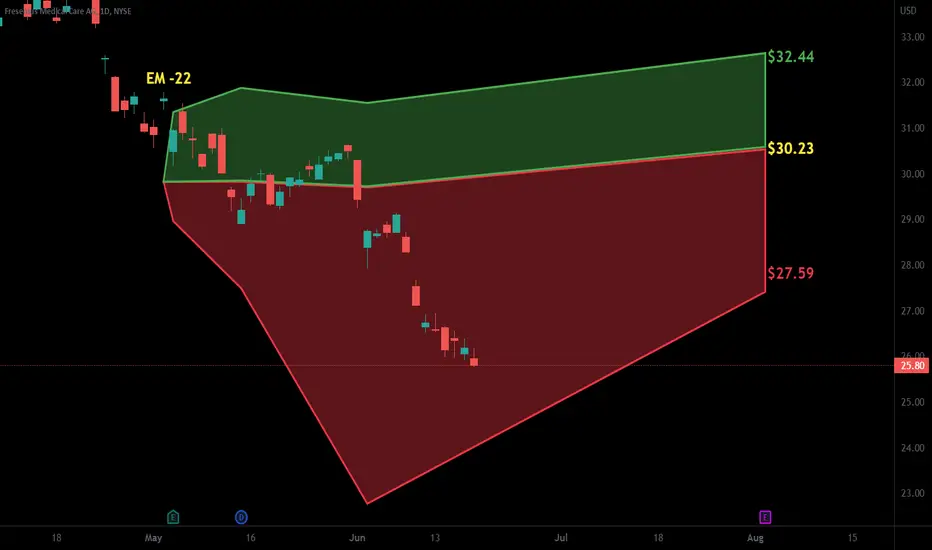
$FMS with a Bullish outlook following its earnings #Stocks The PEAD projected a Bullish outlook for $FMS after a Positive over reaction following its earnings release placing the stock in drift B with an expected accuracy of 71.43%.
Long FME After Earnings ReportHi Traders!
𝗧𝗵𝗲 𝗶𝗻𝗳𝗼𝗿𝗺𝗮𝘁𝗶𝗼𝗻 𝗮𝗻𝗱 𝗮𝗻𝗮𝗹𝘆𝘀𝗶𝘀 𝘀𝗵𝗮𝗿𝗲𝗱 𝗶𝗻 𝘁𝗵𝗶𝘀 video 𝗶𝘀 𝗻𝗼𝘁 𝗳𝗶𝗻𝗮𝗻𝗰𝗶𝗮𝗹 𝗮𝗱𝘃𝗶𝗰𝗲.
𝗔𝗹𝘄𝗮𝘆𝘀 𝗰𝗼𝗻𝗱𝘂𝗰𝘁 𝘆𝗼𝘂𝗿 𝗼𝘄𝗻 𝗮𝗻𝗮𝗹𝘆𝘀𝗶𝘀 𝗮𝗻𝗱 𝗿𝗲𝘀𝗲𝗮𝗿𝗰𝗵.
Happy trading!

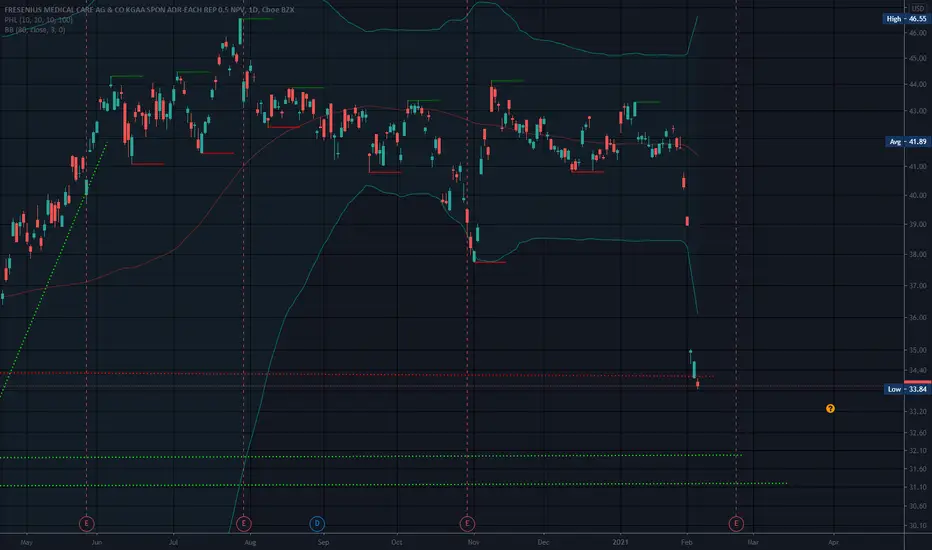
FMC Trade with MOUNT Germany 30 Quant SystemTrading is Waiting - Quants have a lot of time and wait until they the setup fits their requirements.
Traderama uses quant based "buy the valley" strategies for equity trading. This is an example, that the best returns will be achieved if you find the bottom and trade the bounce.
This trade example

FMS Technical Analysis 🧙Fresenius Medical Care is the largest dialysis company in the world, treating about 345,000 patients in roughly 4,000 clinics across the globe as of December 2019. In addition to providing dialysis services, the firm is a leading supplier of dialysis products, including machines, dialyzers, and conc

Pull Back (Bottom) FishingThis is a stock in healthcare and is in the dialysis field. It appears they missed earnings or gave grim guidance. Dialysis is grim, take my word for it )o:
Located in Germany but the clinics are in the US, and not a lot of competition. DVA is one that I know of.
Extremely oversold..
There has
See all ideas
Trade directly on the supercharts through our supported, fully-verified and user-reviewed brokers.


Frequently Asked Questions
The current price of FME.EUR is 70.50 EUR — it hasn't changed in the past 24 hours.
Depending on the exchange, the stock ticker may vary. For instance, on SIX exchange FRESENIUS MEDICAL C stocks are traded under the ticker FME.EUR.
FRESENIUS MEDICAL C is going to release the next earnings report on May 7, 2024. Keep track of upcoming events with our Earnings Calendar.
FME.EUR stock is 0% volatile and has beta coefficient of 1.02. Check out the list of the most volatile stocks — is FRESENIUS MEDICAL C there?
One year price forecast for FRESENIUS MEDICAL C has a max estimate of 50.00 EUR and a min estimate of 21.90 EUR.
FME.EUR earnings for the last quarter are 0.57 EUR per share, whereas the estimation was 0.54 EUR resulting in a 5.06% surprise. The estimated earnings for the next quarter are 0.83 EUR per share. See more details about FRESENIUS MEDICAL C earnings.
FRESENIUS MEDICAL C revenue for the last quarter amounts to 4.94 B EUR despite the estimated figure of 4.90 B EUR. In the next quarter revenue is expected to reach 4.96 B EUR.
Yes, you can track FRESENIUS MEDICAL C financials in yearly and quarterly reports right on TradingView.
FME.EUR net income for the last quarter is 188.00 M EUR, while the quarter before that showed 84.35 M EUR of net income which accounts for 122.88% change. Track more FRESENIUS MEDICAL C financial stats to get the full picture.
Today FRESENIUS MEDICAL C has the market capitalization of 10.69 B, it has decreased by 1.39% over the last week.
Yes, FME.EUR dividends are paid annually. The last dividend per share was 1.12 EUR. As of today, Dividend Yield (TTM)% is 3.07%. Tracking FRESENIUS MEDICAL C dividends might help you take more informed decisions.
FRESENIUS MEDICAL C dividend yield was 3.13% in 2023, and payout ratio reached 69.97%. The year before the numbers were 3.66% and 48.77% correspondingly. See high-dividend stocks and find more opportunities for your portfolio.
Like other stocks, FME.EUR shares are traded on stock exchanges, e.g. Nasdaq, Nyse, Euronext, and the easiest way to buy them is through an online stock broker. To do this, you need to open an account and follow a broker's procedures, then start trading. You can trade FRESENIUS MEDICAL C stock right from TradingView charts — choose your broker and connect to your account.
As of Apr 19, 2024, the company has 119.85 K employees. See our rating of the largest employees — is FRESENIUS MEDICAL C on this list?
Investing in stocks requires a comprehensive research: you should carefully study all the available data, e.g. company's financials, related news, and its technical analysis. So FRESENIUS MEDICAL C technincal analysis shows the sell today, and its 1 week rating is sell. Since market conditions are prone to changes, it's worth looking a bit further into the future — according to the 1 month rating FRESENIUS MEDICAL C stock shows the sell signal. See more of FRESENIUS MEDICAL C technicals for a more comprehensive analysis.
If you're still not sure, try looking for inspiration in our curated watchlists.
If you're still not sure, try looking for inspiration in our curated watchlists.
We've gathered analysts' opinions on FRESENIUS MEDICAL C future price: according to them, FME.EUR price has a max estimate of 50.00 EUR and a min estimate of 21.90 EUR. Read a more detailed FRESENIUS MEDICAL C forecast: see what analysts think of FRESENIUS MEDICAL C and suggest that you do with its stocks.
EBITDA measures a company's operating performance, its growth signifies an improvement in the efficiency of a company. FRESENIUS MEDICAL C EBITDA is 3.28 B EUR, and current EBITDA margin is 16.45%. See more stats in FRESENIUS MEDICAL C financial statements.