Crypto Market Cap, BTC/USD, ETH/USD, USDT/USD, XRP/USD, Bitcoin
LAND SECURITIES GROUP PLC ORD 10 2/3P, BURFORD CAPITAL LIMITED ORD NPV (DI), SMITH & NEPHEW PLC ORD USD0.20, BIDSTACK GROUP PLC ORD 0.5P, LLOYDS BANKING GROUP PLC ORD 10P, BARCLAYS PLC ORD 25P
FTSE 100, DAX Index, Euro Stoxx 50, S&P 500, Nasdaq Composite, Nikkei 225
US 10Y, Euro Bund, Germany 10Y, Japan 10Y Yield, UK 10Y, India 10Y
Technical analysis: . PIVX/BITCOIN is in a range bound and the beginning of uptrend is expected. . The price is below the 21-Day WEMA which acts as a dynamic resistance. . The RSI is at 33. Trading suggestion: . There is a possibility of temporary retracement to suggested support zone (0.00016740 to 0.00014440). if so, traders can set orders based on...
Everything Looks Good On Chart_ At Least 20% Profit
nice entry on this bullish pennant for pivx right now, time to pull the trigger!
Technical analysis: . PIVX/BITCOIN is in a range bound and the beginning of uptrend is expected. . The price is above the 21-Day WEMA which acts as a dynamic support. . The RSI is at 52. . The price downtrend in the daily chart is broken, so the probability of the resumption of an uptrend is increased. Trading suggestion: . There is a possibility of...
Technical analysis: . PIVX/BITCOIN is in a downtrend and the beginning of uptrend is expected. . The price is below the 21-Day WEMA which acts as a dynamic resistance. . The RSI is at 40. . The RSI and the price downtrend in the daily chart are broken, so the probability of the beginning of uptrend is increased. Trading suggestion: . There is a...
Technical analysis: . PIVX/BITCOIN is in a downtrend and the beginning of uptrend is expected. . The price is below the 21-Day WEMA which acts as a dynamic resistance. . The RSI is at 31. . The RSI downtrend & The price downtrend in the daily chart are broken, so the probability of the beginning of uptrend is increased. . There is a valid and clear divergence...
Technical analysis: . PIVX/BITCOIN is in a range bound and beginning of uptrend is expected. . The price is below the 21-Day WEMA which acts as a dynamic resistance. . The RSI is at 26. Trading suggestion: . The price is in a range bound and we forecast the uptrend would begin. . There is a possibility of temporary retracement to suggested support zone...
it will be start to rise up at 0,00081-0,00079(there is a bullish bat harmonic formation) and the target is 0,001400.
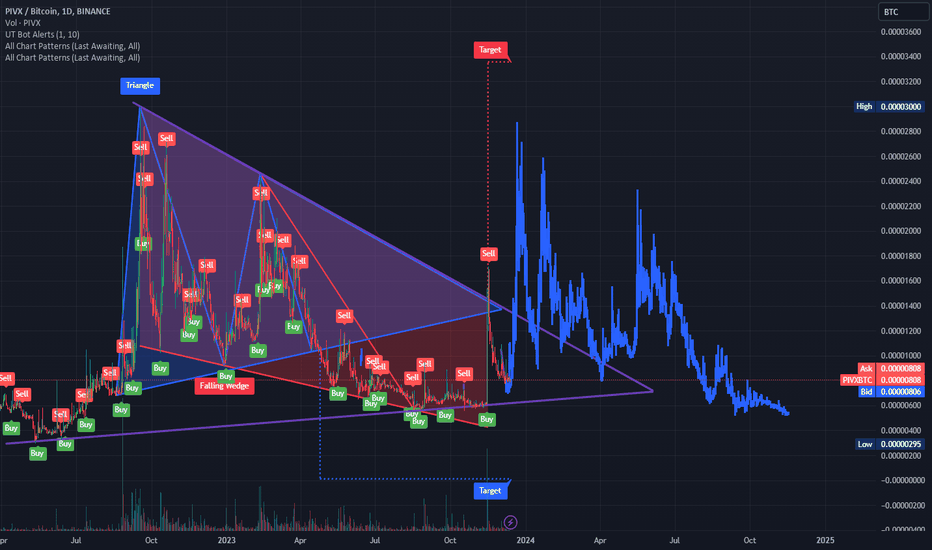
What do you think of the current position of PIVX? It looks to me that a 4th triangle might occur for a nice 30%+ profit. It could become far greater profit if the resistance breaks. However, upon releasing this analysis, it could still break out of the triangle at the bottom, which would mean it goes down more.
Keeping the TA simple but the geometry for a bull pennant lies there, will PIVX be taken to new heights against bitcoin or is that a rejection we see with a bearish pennant forming a funnel now?!? Given the buying pressure seen withing the bullish bursts I wouldn't expect so but only time will tell.
If this breaks up from this wedge, could be a nice upswing. NEWS: ZEROCOIN will be available October 16, 2017 new launch from PIVX. pivx.org