−0.0287USD
−21.23 MUSD
275.71 KUSD
561.76 M
About AFC Energy Plc.
Sector
Industry
CEO
Adam Steven Bond
Website
Headquarters
Cranleigh
Employees (FY)
113
Founded
2006
ISIN
GB00B18S7B29
FIGI
BBG002KB2K38
AFC Energy Plc engages in the development of fuel cells. Its objective is to install, own, operate, and maintain stationary alkaline systems that generate durable power of fuel efficiency for the future. The company was founded by Howard White on January 9, 2006 and is headquartered in Cranleigh, the United Kingdom.

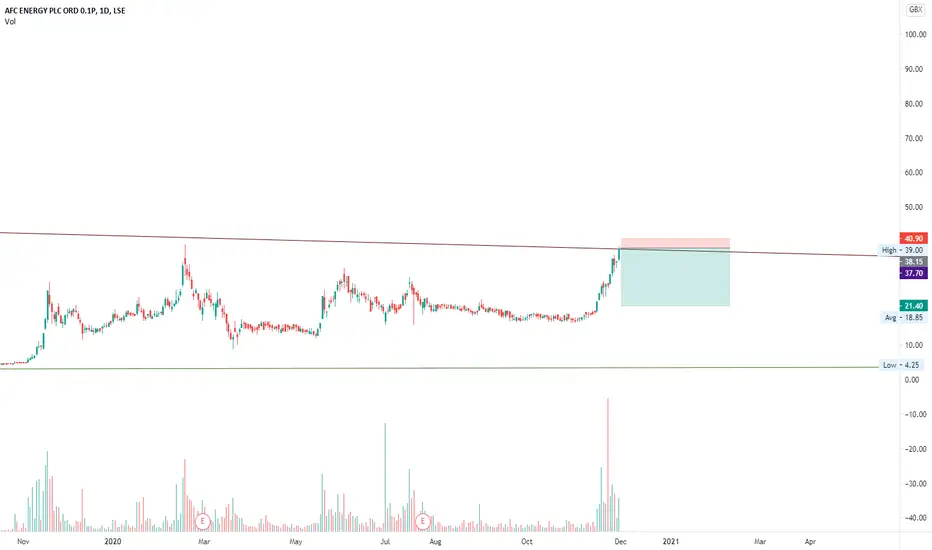
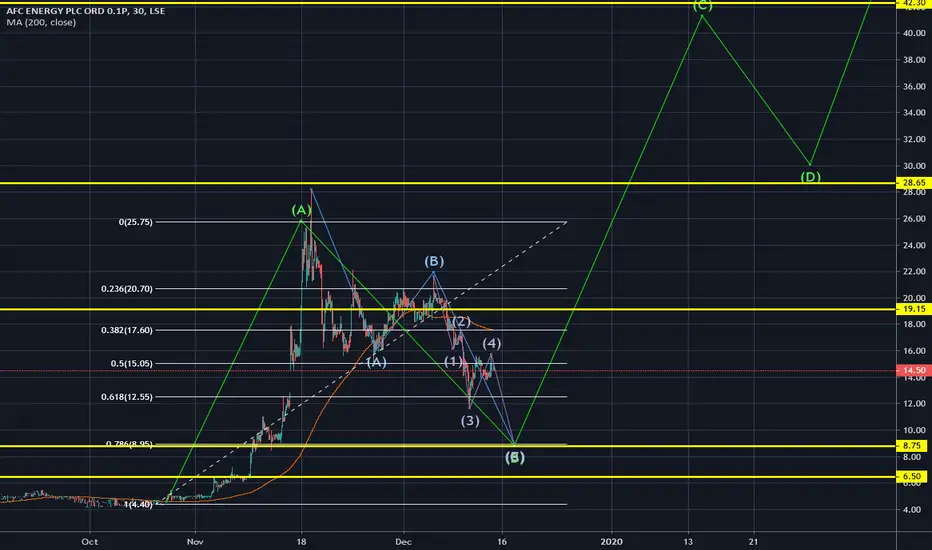
just my 2 cents on afcnormally just charting blue chips for options trading, but since i'm in love with afc, i share my short term view/hope. I have no trading position in afc, so this is just for fun

AFC Energy - Long positionLSE:AFC
Expected trajectory following bullish patterns after extended constrained period.


AFC Energy - alert triggered. AFC Energy (AFC.L), the industrial fuel cell power company, today announced the successful deployment of CH2ARGETM, the world’s first electric vehicle charger based on hydrogen fuel-cell technology. The breakthrough by the UK-based energy technology company could enable 100% clean electricity for fu

See all ideas
Trade directly on the supercharts through our supported, fully-verified and user-reviewed brokers.


Frequently Asked Questions
The current price of AFGYF is 0.2217 USD — it has increased by 4.04% in the past 24 hours.
Depending on the exchange, the stock ticker may vary. For instance, on OTC exchange AFC Energy Plc. stocks are traded under the ticker AFGYF.
AFC Energy Plc. is going to release the next earnings report on Jul 26, 2024. Keep track of upcoming events with our Earnings Calendar.
AFGYF stock is 3.88% volatile and has beta coefficient of 0.60. Check out the list of the most volatile stocks — is AFC Energy Plc. there?
Yes, you can track AFC Energy Plc. financials in yearly and quarterly reports right on TradingView.
AFGYF stock has fallen by 0.14% compared to the previous week, the month change is a 1.23% rise, over the last year AFC Energy Plc. has showed a 9.51% decrease.
AFGYF net income for the last quarter is −13.63 M USD, while the quarter before that showed −7.85 M USD of net income which accounts for −73.57% change. Track more AFC Energy Plc. financial stats to get the full picture.
Today AFC Energy Plc. has the market capitalization of 175.78 M, it has decreased by 6.76% over the last week.
No, AFGYF doesn't pay any dividends to its shareholders. But don't worry, we've prepared a list of high-dividend stocks for you.
Like other stocks, AFGYF shares are traded on stock exchanges, e.g. Nasdaq, Nyse, Euronext, and the easiest way to buy them is through an online stock broker. To do this, you need to open an account and follow a broker's procedures, then start trading. You can trade AFC Energy Plc. stock right from TradingView charts — choose your broker and connect to your account.
As of Apr 25, 2024, the company has 113.00 employees. See our rating of the largest employees — is AFC Energy Plc. on this list?
Investing in stocks requires a comprehensive research: you should carefully study all the available data, e.g. company's financials, related news, and its technical analysis. So AFC Energy Plc. technincal analysis shows the sell today, and its 1 week rating is neutral. Since market conditions are prone to changes, it's worth looking a bit further into the future — according to the 1 month rating AFC Energy Plc. stock shows the sell signal. See more of AFC Energy Plc. technicals for a more comprehensive analysis.
If you're still not sure, try looking for inspiration in our curated watchlists.
If you're still not sure, try looking for inspiration in our curated watchlists.
We've gathered analysts' opinions on AFC Energy Plc. future price: according to them, AFGYF price has a max estimate of 1.58 USD and a min estimate of 0.51 USD. Read a more detailed AFC Energy Plc. forecast: see what analysts think of AFC Energy Plc. and suggest that you do with its stocks.
EBITDA measures a company's operating performance, its growth signifies an improvement in the efficiency of a company. AFC Energy Plc. EBITDA is −22.30 M USD, and current EBITDA margin is −8.09 K%. See more stats in AFC Energy Plc. financial statements.