−0.42USD
−12.10 MUSD
1.92 BUSD
2.39 M
About Valhi, Inc.
Sector
CEO
Michael S. Simmons
Headquarters
Dallas
Website
Employees (FY)
2.2 K
Founded
1987
ISIN
US9189052098
FIGI
BBG000BWCZY8
Valhi, Inc. is a holding company, which engages in the manufacture and marketing of titanium dioxide pigments. It operates through the following segments: Chemicals, Component Products, and Real Estate Management and Development. The Chemicals segment produces and markets titanium dioxide pigments for paints, plastics, paper, fibers, and ceramics. The Component Products segment includes security products used in the recreational transportation, postal, office and institutional furniture, tool storage, healthcare, and a variety of other industries. The Real Estate Management and Development segment covers real estate management and development. The company was founded in 1987 and is headquartered in Dallas, TX.


LONG for wave 3 completion ( not Elliot waves )Buy VHI for +80% increase on 4H/Daily chart for wave 3 completion


No Volume, No New HighThe volume that originally had begun this strong uptrend has dwindled away. Now it looks like price has bounced off of this year old resistance around $2.84 for the third time. Entered short position at $2.82, with a stop set at $2.94, looking to take profits around $2.54

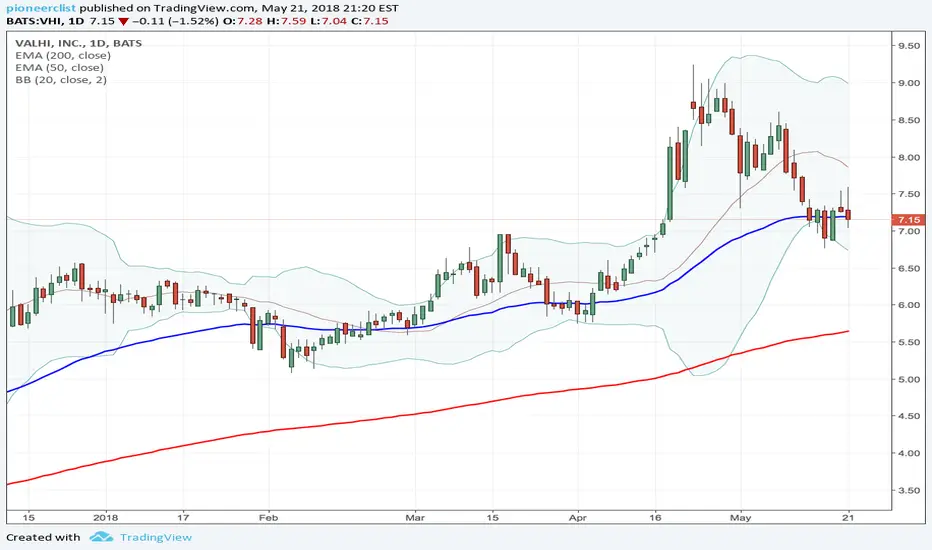
Moving Average about to cross20EMA is about to cross 200EMA, suggests a bullish upward movement if does.

VHI - EXPECTING MORE UPSIDEVHI is an earning winner, with over 66% surprize. It has broken the previous consolidation area with a bullish divergence and a huge spike in volume. If the dotted line holds i'm expecting more upside. Possible target on chart.

See all ideas
Trade directly on the supercharts through our supported, fully-verified and user-reviewed brokers.


Frequently Asked Questions
The current price of VHI is 15.50 USD — it has increased by 2.65% in the past 24 hours.
Depending on the exchange, the stock ticker may vary. For instance, on NYSE exchange Valhi, Inc. stocks are traded under the ticker VHI.
Valhi, Inc. is going to release the next earnings report on May 9, 2024. Keep track of upcoming events with our Earnings Calendar.
VHI stock is 4.03% volatile and has beta coefficient of 0.64. Check out the list of the most volatile stocks — is Valhi, Inc. there?
One year price forecast for Valhi, Inc. has a max estimate of 11.00 USD and a min estimate of 11.00 USD.
VHI earnings for the last quarter are −0.21 USD per share, whereas the estimation was 0.01 USD resulting in a −1.72 K% surprise. The estimated earnings for the next quarter are 0.05 USD per share. See more details about Valhi, Inc. earnings.
Yes, you can track Valhi, Inc. financials in yearly and quarterly reports right on TradingView.
VHI stock has risen by 0.91% compared to the previous week, the month change is a 2.52% fall, over the last year Valhi, Inc. has showed a 8.28% decrease.
VHI net income for the last quarter is 3.90 M USD, while the quarter before that showed −6.00 M USD of net income which accounts for 165.00% change. Track more Valhi, Inc. financial stats to get the full picture.
Today Valhi, Inc. has the market capitalization of 427.16 M, it has decreased by 0.86% over the last week.
Yes, VHI dividends are paid quarterly. The last dividend per share was 0.08 USD. As of today, Dividend Yield (TTM)% is 2.12%. Tracking Valhi, Inc. dividends might help you take more informed decisions.
Like other stocks, VHI shares are traded on stock exchanges, e.g. Nasdaq, Nyse, Euronext, and the easiest way to buy them is through an online stock broker. To do this, you need to open an account and follow a broker's procedures, then start trading. You can trade Valhi, Inc. stock right from TradingView charts — choose your broker and connect to your account.
As of Apr 20, 2024, the company has 2.20 K employees. See our rating of the largest employees — is Valhi, Inc. on this list?
Investing in stocks requires a comprehensive research: you should carefully study all the available data, e.g. company's financials, related news, and its technical analysis. So Valhi, Inc. technincal analysis shows the buy rating today, and its 1 week rating is buy. Since market conditions are prone to changes, it's worth looking a bit further into the future — according to the 1 month rating Valhi, Inc. stock shows the sell signal. See more of Valhi, Inc. technicals for a more comprehensive analysis.
If you're still not sure, try looking for inspiration in our curated watchlists.
If you're still not sure, try looking for inspiration in our curated watchlists.
We've gathered analysts' opinions on Valhi, Inc. future price: according to them, VHI price has a max estimate of 11.00 USD and a min estimate of 11.00 USD. Read a more detailed Valhi, Inc. forecast: see what analysts think of Valhi, Inc. and suggest that you do with its stocks.
EBITDA measures a company's operating performance, its growth signifies an improvement in the efficiency of a company. Valhi, Inc. EBITDA is 23.10 M USD, and current EBITDA margin is 1.14%. See more stats in Valhi, Inc. financial statements.