Earnings JournalAT A GLANCE
Simplistic Analysis: sell trend to a floor.
Trade Type: Sell & Hold wait for a close.
Research Depth: technical glance only.
Earnings Anticipations: positive surprises for EPS & Revenues.
Earnings confidence on a scale of 1-5: 3
−1.96USD
24.00 MUSD
30.27 BUSD
57.81 M
About United Natural Foods, Inc.
Sector
Industry
CEO
J. Alexander M. Douglas
Website
Headquarters
Providence
Employees (FY)
29.46 K
Founded
1976
ISIN
US9111631035
FIGI
BBG000BXB1M5
United Natural Foods, Inc. engages in the distribution of natural, organic, and specialty foods and non-food products. The firm operates through the Wholesale and Retail segments. The Wholesale segment is engaged in the national distribution of natural, organic, specialty, produce, and conventional grocery and non-food products, and providing retail services in the United States and Canada. The Retail segment derives revenues from the sale of groceries and other products at retail locations operated by company. It offers food and non food, frozen, perishables, bulk, body care products, and supplements. The company was founded by Michael S. Funk and Norman A. Cloutier in July 1976 and is headquartered in Providence, RI.

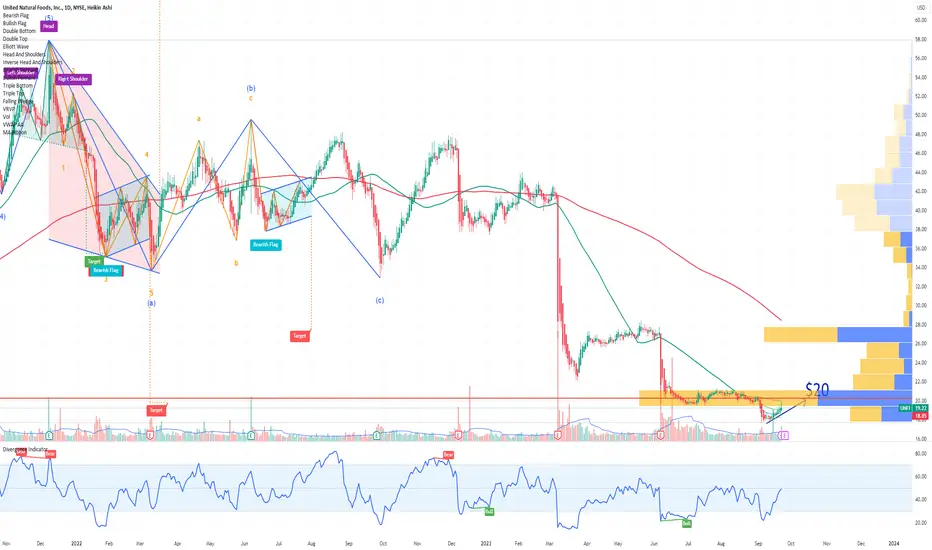
UNFI United Natural Foods Options Ahead of EarningsAnalyzing the options chain and the chart patterns of KBH KB Home prior to the earnings report this week,
I would consider purchasing the 20usd strike price Calls with
an expiration date of 2024-2-16,
for a premium of approximately $2.12.
If these options prove to be profitable prior to the earnings
$UNFI = Undervalued - Call - LongUnfi took a major hit recently with CEO resignation. Price tumbled hard, and does not represent the current valuation of this company. Closer valuation is $30.00 and rising. It just broke out of the flag and resting on support for next leg up.

UNFIthere is a support area confluence with trend line and ema200 u can enter after u see bull pressure and candlestick pattern .
the results of the company's financial information are acceptable :
market cap : 2.62 B
p/e : 12.47
p/s : 0.10
p/b : 1.64
peg : 1.73
Quick Ratio : 0.60
Current Ratio :1.50
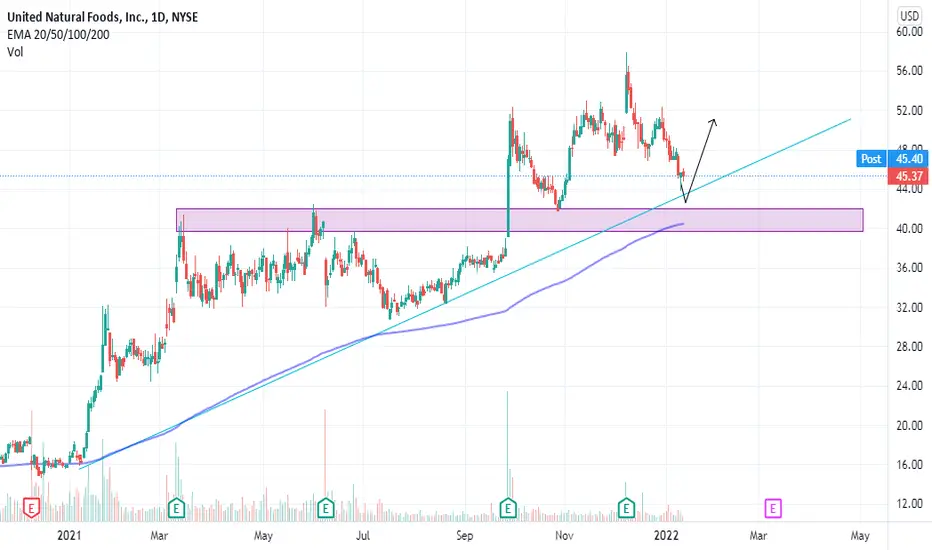
UNFI: Ascending Triangle (60%) Cup'n Handle (86%)UNFI is showing an ascending triangle on the daily chart with a possible target price of 66.58$.
The weekly chart's Cup'n handle shows some additional potential gains with a price target of 73.23$.
The weekly chart of the sector to which UNFI belongs (Consumer Staples) is currently into a confirme

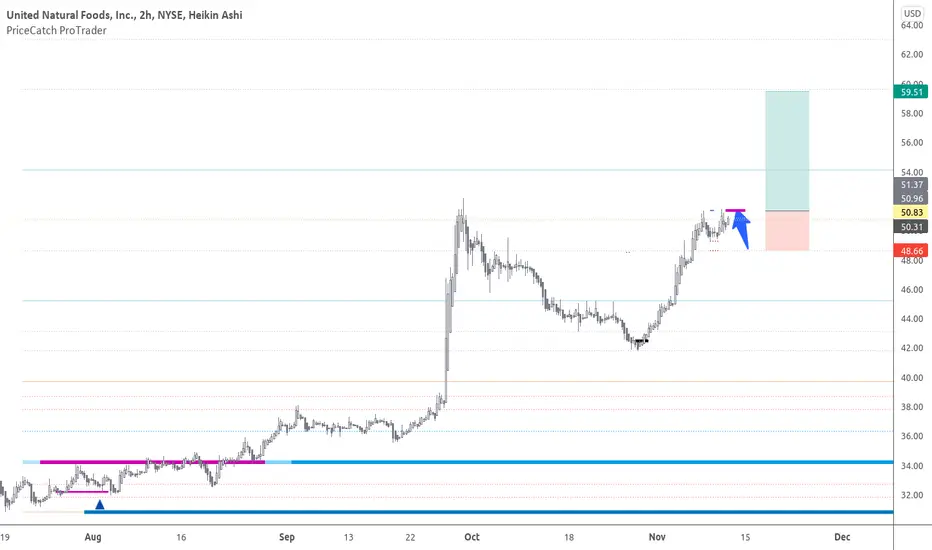
UNFI United Natural Foods - A Long OpportunityI was looking at $UNFI on 2H time frame and my chart tells me that a long entry if taken above $51.3 with SL at $48 will result in a decent profitable trade with 1:3 RR. I am recording this opinion for my reference. Feedback welcome.
UNFI - we are finding support on the orange ringsThis is a stock I would like to own for the long term. We seem to have overhead fib resistance sloping down and support below us on the orange fib ring. Earnings is estimated to be around December 5th. The last earnings pump sent us to >$50. The entry I'm looking to take is $35-$40.
Consider sellin

UNFI cup and handle pattern on all chartsUNFI is forming a cup and handle chart pattern after the enormous rally it stopped at a previous top from years ago and is now congesting the gains downward forming a handle. Keep in mind the chart being posted is a weekly chart, the handle appears much clearer in the daily.just something to keep an


UNFI: Unsure but worthy of the riskFrom a first impression the stock looks great. The 50 day SMA is above the 200 day SMA, we are trading at ATH and ER (28th of September) was perceived positively from the market. We have an unprecedented spike in Volume corresponding to the 28th of September which would confirm the "victory" of this

See all ideas
Trade directly on the supercharts through our supported, fully-verified and user-reviewed brokers.


Curated watchlists where UNFI is featured.


Frequently Asked Questions
The current price of UNFI is 9.35 USD — it has increased by 0.75% in the past 24 hours.
Depending on the exchange, the stock ticker may vary. For instance, on NYSE exchange United Natural Foods, Inc. stocks are traded under the ticker UNFI.
United Natural Foods, Inc. is going to release the next earnings report on Jun 5, 2024. Keep track of upcoming events with our Earnings Calendar.
UNFI stock is 3.35% volatile and has beta coefficient of 1.42. Check out the list of the most volatile stocks — is United Natural Foods, Inc. there?
One year price forecast for United Natural Foods, Inc. has a max estimate of 14.00 USD and a min estimate of 11.00 USD.
UNFI earnings for the last quarter are −0.04 USD whereas the estimation was −0.32 USD which accounts for 87.34% surprise. Estimated earnings for the next quarter are −0.02 USD. See more details about United Natural Foods, Inc. earnings.
United Natural Foods, Inc. revenue for the last quarter amounts to 7.55 B USD despite the estimated figure of 7.61 B USD. In the next quarter revenue is expected to reach 7.87 B USD.
Yes, you can track United Natural Foods, Inc. financials in yearly and quarterly reports right on TradingView.
UNFI stock has fallen by 8.87% compared to the previous week, the month change is a 21.43% fall, over the last year United Natural Foods, Inc. has showed a 63.83% decrease.
UNFI net income for the last quarter is −15.00 M USD, while the quarter before that showed −39.00 M USD of net income which accounts for 61.54% change. Track more United Natural Foods, Inc. financial stats to get the full picture.
Today United Natural Foods, Inc. has the market capitalization of 551.57 M, it has decreased by 4.84% over the last week.
No, UNFI doesn't pay any dividends to its shareholders. But don't worry, we've prepared a list of high-dividend stocks for you.
Like other stocks, UNFI shares are traded on stock exchanges, e.g. Nasdaq, Nyse, Euronext, and the easiest way to buy them is through an online stock broker. To do this, you need to open an account and follow a broker's procedures, then start trading. You can trade United Natural Foods, Inc. stock right from TradingView charts — choose your broker and connect to your account.
As of Apr 19, 2024, the company has 29.46 K employees. See our rating of the largest employees — is United Natural Foods, Inc. on this list?
Investing in stocks requires a comprehensive research: you should carefully study all the available data, e.g. company's financials, related news, and its technical analysis. So United Natural Foods, Inc. technincal analysis shows the sell today, and its 1 week rating is sell. Since market conditions are prone to changes, it's worth looking a bit further into the future — according to the 1 month rating United Natural Foods, Inc. stock shows the strong sell signal. See more of United Natural Foods, Inc. technicals for a more comprehensive analysis.
If you're still not sure, try looking for inspiration in our curated watchlists.
If you're still not sure, try looking for inspiration in our curated watchlists.
We've gathered analysts' opinions on United Natural Foods, Inc. future price: according to them, UNFI price has a max estimate of 14.00 USD and a min estimate of 11.00 USD. Read a more detailed United Natural Foods, Inc. forecast: see what analysts think of United Natural Foods, Inc. and suggest that you do with its stocks.
EBITDA measures a company's operating performance, its growth signifies an improvement in the efficiency of a company. United Natural Foods, Inc. EBITDA is 364.00 M USD, and current EBITDA margin is 1.49%. See more stats in United Natural Foods, Inc. financial statements.