What's happening today with Block, Inc.
- •Baird has maintained an Outperform rating on Block (SQ) and increased the price target from $95.00 to $98.00 per share.
12674.14
0.01USD
9.77 MUSD
21.92 BUSD
541.67 M
About Block, Inc.
Sector
Industry
Headquarters
Oakland
Website
Employees (FY)
12.99 K
Founded
2009
ISIN
US8522341036
FIGI
BBG0018SLC07
Block, Inc. engages in creating ecosystems for distinct customer audiences. It operates through the Square and Cash App segments. The Square segment provides businesses the ability to accept card payments. The Cash App segment offers an ecosystem of financial products and services to help consumers manage their money. The company was founded by Jack Patrick Dorsey and James Morgan McKelvey in February 2009 and is headquartered in Oakland, CA.

Iron Condor on SQThis is over earnings. The 90/95 bear call spread is above the 100 sma on the monthly.
The 60/55 bull put spread is below the 100/200 sma on the daily and 100sma on the weekly
Simply expecting NOT a huge gap on earnings and allow the IV to fizzle out on this one. Since we are getting $1.00+ on a $

😎📦Building Blocks to Riches 💰😎 - AW™️Block lookin sexy AF. Bought shares today and will add more if this tries to shake people by the sideways.
Technicals :
Hagopian Line Support
50 Algo Target Acquired
Wave 4 Pattern
Initial Target: Mid 100s
✌️

SQ, trying to clear anchored vwap from IPO. we will seelike i said , "SQ, trying to clear anchored vwap from IPO. we will see"
not financial advise just my observations

Long On SQIf Candle Closes above resistance, we can see 130s by the end of the year!
Exciting times!

H&S unfolding on $SQPotential pattern forming. Bullish move will invalidate pattern. I am short to the neckline with a tight stop.

Looking for an immediate put swing on SQ!🔉Sound on!🔉
Thank you as always for watching my videos. I hope that you learned something very educational! Please feel free to like, share, and comment on this post. Remember only risk what you are willing to lose. Trading is very risky but it can change your life!

SQ both waysDropping this here to see how it plays out. this is prob one of the greatest features of tradingview. its almost like a journal for these things
ofc everything depends on premarket but my play is on the chart lets see what happens

Bitkey Revolutionizes Bitcoin Custody with New Hardware DeviceBitkey, the innovative self-custody bitcoin wallet developed by the Proto team at Block, Inc. (NYSE: NYSE:SQ ), is poised to transform the landscape of bitcoin ownership and management. With the commencement of shipping for its first hardware devices and the introduction of advanced security and re
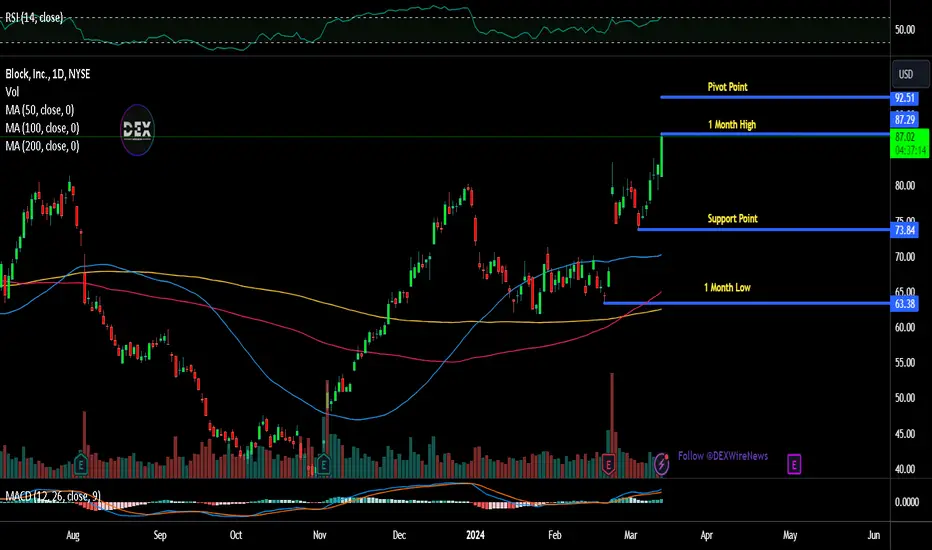
SQ - Breaks above weekly EMA100. Can break above 92 ? SQ - Right and Left shoulders almost similar width.
👍 Weekly Slow turtle signal has triggered.
👍 FiFT is +ve with Higher High.
👍 MCDX Retailer is below 10% ..
👍MCDX Banker is above 50% and Strong.
Next :-
Need to stay above 100 EMA lines
Then breaks above 92-94
Look for break and retest 92-94

See all ideas
Trade directly on the supercharts through our supported, fully-verified and user-reviewed brokers.


Curated watchlists where SQ is featured.


Frequently Asked Questions
The current price of SQ is 71.32 USD — it has decreased by 1.03% in the past 24 hours.
Depending on the exchange, the stock ticker may vary. For instance, on NYSE exchange Block, Inc. stocks are traded under the ticker SQ.
Block, Inc. is going to release the next earnings report on May 2, 2024. Keep track of upcoming events with our Earnings Calendar.
SQ stock is 2.46% volatile and has beta coefficient of 3.50. Check out the list of the most volatile stocks — is Block, Inc. there?
One year price forecast for Block, Inc. has a max estimate of 110.00 USD and a min estimate of 60.00 USD.
SQ earnings for the last quarter are 0.55 USD per share, whereas the estimation was 0.47 USD resulting in a 18.21% surprise. The estimated earnings for the next quarter are 0.58 USD per share. See more details about Block, Inc. earnings.
Block, Inc. revenue for the last quarter amounts to 5.62 B USD despite the estimated figure of 5.41 B USD. In the next quarter revenue is expected to reach 5.70 B USD.
Yes, you can track Block, Inc. financials in yearly and quarterly reports right on TradingView.
SQ stock has fallen by 9.55% compared to the previous week, the month change is a 9.40% fall, over the last year Block, Inc. has showed a 15.55% increase.
SQ net income for the last quarter is 178.07 M USD, while the quarter before that showed −28.95 M USD of net income which accounts for 715.01% change. Track more Block, Inc. financial stats to get the full picture.
Today Block, Inc. has the market capitalization of 44.37 B, it has decreased by 1.09% over the last week.
No, SQ doesn't pay any dividends to its shareholders. But don't worry, we've prepared a list of high-dividend stocks for you.
Like other stocks, SQ shares are traded on stock exchanges, e.g. Nasdaq, Nyse, Euronext, and the easiest way to buy them is through an online stock broker. To do this, you need to open an account and follow a broker's procedures, then start trading. You can trade Block, Inc. stock right from TradingView charts — choose your broker and connect to your account.
As of Apr 19, 2024, the company has 12.99 K employees. See our rating of the largest employees — is Block, Inc. on this list?
Investing in stocks requires a comprehensive research: you should carefully study all the available data, e.g. company's financials, related news, and its technical analysis. So Block, Inc. technincal analysis shows the sell today, and its 1 week rating is sell. Since market conditions are prone to changes, it's worth looking a bit further into the future — according to the 1 month rating Block, Inc. stock shows the sell signal. See more of Block, Inc. technicals for a more comprehensive analysis.
If you're still not sure, try looking for inspiration in our curated watchlists.
If you're still not sure, try looking for inspiration in our curated watchlists.
We've gathered analysts' opinions on Block, Inc. future price: according to them, SQ price has a max estimate of 110.00 USD and a min estimate of 60.00 USD. Read a more detailed Block, Inc. forecast: see what analysts think of Block, Inc. and suggest that you do with its stocks.
EBITDA measures a company's operating performance, its growth signifies an improvement in the efficiency of a company. Block, Inc. EBITDA is 1.27 B USD, and current EBITDA margin is 5.42%. See more stats in Block, Inc. financial statements.