SLB Schlumberger Limited Options Ahead of EarningsAnalyzing the options chain and the chart patterns of SLB Schlumberger Limited prior to the earnings report this week,
I would consider purchasing the 54usd strike price in the money Puts with
an expiration date of 2024-4-19,
for a premium of approximately $3.10.
If these options prove to be profita
2.95USD
4.20 BUSD
33.13 BUSD
1.42 B
About Schlumberger N.V.
Sector
Industry
CEO
Olivier Le Peuch
Website
Headquarters
Houston
Employees (FY)
111 K
Founded
1926
ISIN
AN8068571086
FIGI
BBG000BT41Q8
SLB NV engages in the provision of energy technology. It operates through the following business segments: Digital and Integration, Reservoir Performance, Well Construction, and Production Systems. The Digital and Integration segment involves the combination of digital solutions and data products with its Asset Performance Solutions. The Reservoir Performance segment consists of technologies and services for productivity and performance optimization. The Well Construction segment includes the full portfolio of products and services for well placement and performance, drilling, and wellbore assurance. The Production Systems segment focuses on the development of technologies and provides services to production and recovery from subsurface reservoirs to the surface, into pipelines, and to refineries. The company was founded by Conrad Schlumberger and Marcel Schlumberger in 1926 and is headquartered in Houston, TX.

Investment Opportunity SLB (Short)SLB is Bearish in 6months timeframe, the price is back on supply which initiated this bearish trend, we can see now that the price ic currently accumulating orders, a wyckoff is in place.
I'm expecting now the price to reach downside liquidity at 39.5 $ and potentially continue until 16$.
Upside r

SLB Set To Acquire ChampionX, Return $7 Bln To ShareholdersNYSE:SLB , formerly known as Schlumberger, has announced plans to acquire ChampionX ( NASDAQ:CHX ), a leading provider of chemistry solutions and drilling technology. The acquisition, coupled with a substantial $7 billion shareholder return plan, signals SLB's commitment to driving growth and delive

SLB, 1/24-3/28, 9.5% profitOn 1/19/2024, SLB (SLB) reported earnings of $0.86 per share on revenue of $8.99 billion for the fourth quarter ended December 2023. The consensus earnings estimate was $0.84 per share on revenue of $9.00 billion.

Shlumberger - SLB LongA failed dragon turned into a beautiful falling 3 drives pattern with bullish divergence all happening at a long respected demand line.
Easy trade to size up risk on, again never know what will happen.
Unfortunately this is one again that we took and posted in the community two weeks ago. It wou

Monitoring $SLB to enterValuation seems very attractive
Earnings are expected to grow moving forward
However the share price trend looks bearish
Will have to monitor if it will break the support level
or it's undergoing a turnaround from the low.
The share price is also somewhat moving in line with the WTI oil price.

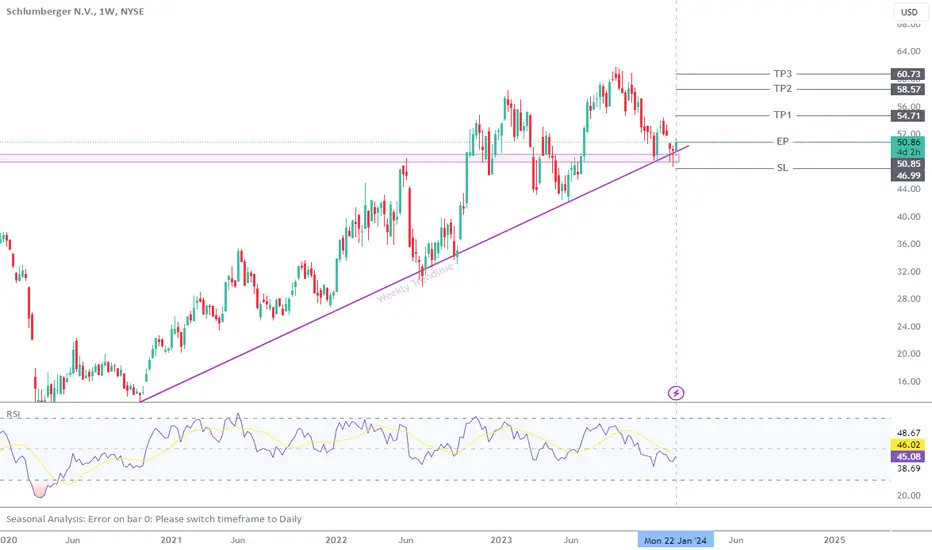
SLB Potential Buy setupReasons for bullish bias:
- Price respected strong trendline
- Hammer candle formation on the support
Entry Level: 50.85
Stop Loss Level: 46.99
Take Profit Level 1: 54.71
Take Profit Level 2: 58.57
Take Profit Level 3: 60.73
Schlumberger's Stellar Performance in 2023: Key Highlights
Schlumberger Limited (NYSE: NYSE:SLB ), a world-renowned oilfield services provider, has concluded a remarkable year, surpassing analysts' estimates for quarterly profit and showcasing robust growth in its international business. Despite geopolitical uncertainties and regional tensions, NYSE:SLB

Uptrend is in an early stage - Bullish signal is in NYSE:SLB is heading for an early bullish signal after the price action shows an early stage of potential upside. First, Ichimoku's conversion and baseline are performing a crossover. Next the strong bullish rebound on 14th Dec marks the early interest of the bull.

Stocks pairs trading: VLO vs SLBIn the energy sector, a comparative analysis of financial metrics and market dynamics between Valero Energy Corporation (VLO) and Schlumberger Limited (SLB) reveals distinct investment perspectives. Examining their financial performance and market standings suggests a strategic approach to investing

See all ideas
Trade directly on the supercharts through our supported, fully-verified and user-reviewed brokers.


Frequently Asked Questions
The current price of SLB is 50.94 USD — it has increased by 0.26% in the past 24 hours.
Depending on the exchange, the stock ticker may vary. For instance, on NYSE exchange Schlumberger N.V. stocks are traded under the ticker SLB.
Schlumberger N.V. is going to release the next earnings report on Apr 19, 2024. Keep track of upcoming events with our Earnings Calendar.
SLB stock is 1.91% volatile and has beta coefficient of 0.72. Check out the list of the most volatile stocks — is Schlumberger N.V. there?
One year price forecast for Schlumberger N.V. has a max estimate of 81.00 USD and a min estimate of 57.00 USD.
SLB earnings for the last quarter are 0.78 USD whereas the estimation was 0.77 USD which accounts for 1.86% surprise. Estimated earnings for the next quarter are 0.84 USD. See more details about Schlumberger N.V. earnings.
Schlumberger N.V. revenue for the last quarter amounts to 8.31 B USD despite the estimated figure of 8.32 B USD. In the next quarter revenue is expected to reach 8.96 B USD.
Yes, you can track Schlumberger N.V. financials in yearly and quarterly reports right on TradingView.
SLB stock has fallen by 6.19% compared to the previous week, the month change is a 4.84% fall, over the last year Schlumberger N.V. has showed a 1.89% decrease.
SLB net income for the last quarter is 1.11 B USD, while the quarter before that showed 1.12 B USD of net income which accounts for −0.89% change. Track more Schlumberger N.V. financial stats to get the full picture.
Today Schlumberger N.V. has the market capitalization of 72.31 B, it has decreased by 1.84% over the last week.
Yes, SLB dividends are paid quarterly. The last dividend per share was 0.28 USD. As of today, Dividend Yield (TTM)% is 2.02%. Tracking Schlumberger N.V. dividends might help you take more informed decisions.
Schlumberger N.V. dividend yield was 1.92% in 2023, and payout ratio reached 34.33%. The year before the numbers were 1.22% and 27.14% correspondingly. See high-dividend stocks and find more opportunities for your portfolio.
Like other stocks, SLB shares are traded on stock exchanges, e.g. Nasdaq, Nyse, Euronext, and the easiest way to buy them is through an online stock broker. To do this, you need to open an account and follow a broker's procedures, then start trading. You can trade Schlumberger N.V. stock right from TradingView charts — choose your broker and connect to your account.
As of Apr 19, 2024, the company has 111.00 K employees. See our rating of the largest employees — is Schlumberger N.V. on this list?
Investing in stocks requires a comprehensive research: you should carefully study all the available data, e.g. company's financials, related news, and its technical analysis. So Schlumberger N.V. technincal analysis shows the sell today, and its 1 week rating is neutral. Since market conditions are prone to changes, it's worth looking a bit further into the future — according to the 1 month rating Schlumberger N.V. stock shows the neutral signal. See more of Schlumberger N.V. technicals for a more comprehensive analysis.
If you're still not sure, try looking for inspiration in our curated watchlists.
If you're still not sure, try looking for inspiration in our curated watchlists.
We've gathered analysts' opinions on Schlumberger N.V. future price: according to them, SLB price has a max estimate of 81.00 USD and a min estimate of 57.00 USD. Read a more detailed Schlumberger N.V. forecast: see what analysts think of Schlumberger N.V. and suggest that you do with its stocks.
EBITDA measures a company's operating performance, its growth signifies an improvement in the efficiency of a company. Schlumberger N.V. EBITDA is 7.77 B USD, and current EBITDA margin is 21.63%. See more stats in Schlumberger N.V. financial statements.