SJM The J. M. Smucker Company Options Ahead of EarningsAnalyzing the options chain and the chart patterns of SJM The J. M. Smucker Company prior to the earnings report this week,
I would consider purchasing the 140usd strike price in the money Calls with
an expiration date of 2023-9-15,
for a premium of approximately $4.60.
If these options prove to be
−0.85USD
−91.20 MUSD
8.53 BUSD
103.55 M
About The J.M. Smucker Company
Sector
CEO
Mark T. Smucker
Headquarters
Orrville
Website
Employees (FY)
5.8 K
Founded
1897
ISIN
US8326964058
FIGI
BBG000BT1715
The J. M. Smucker Co. engages in the manufacture and marketing of food and beverage products. It operates through the following segments: U.S. Retail Coffee, U.S. Retail Frozen Handheld and Spreads, U.S. Retail Pet Foods, and Sweet Baked Snacks. The U.S. Retail Coffee segment includes the domestic sales of Folgers, Dunkin’, and Café Bustelo branded coffee. The U.S. Retail Frozen Handheld and Spreads segment focuses on domestic sales of Smucker’s and Jif branded products. The U.S. Retail Pet Foods segment is involved in the domestic sales of Meow Mix, Milk-Bone, Pup-Peroni, and Canine Carry Outs branded products. The Sweet Baked Snacks segment refers to all domestic and foreign sales of Hostess and Voortman branded products in all channels. The company was founded by Jerome Monroe Smucker in 1897 and is headquartered in Orrville, OH.


$SJM with a Bullish outlook following its earnings #Stocks The PEAD projected a Bullish outlook for $SJM after a Negative over reaction following its earnings release placing the stock in drift C with an expected accuracy of 66.67%.

QuickTrade n. 56 : SJMLong : Looking for a positive test of the fast 21h/50h on the 250h
Short : Looking for a bearish cross

$SJM with a Neutral outlook following its earnings #Stocks The PEAD projected a Neutral outlook for $SJM after a Negative over reaction following its earnings release placing the stock in drift C with an expected accuracy of 75%.

$SJM with a Neutral outlook following its earnings #Stocks The PEAD projected a Neutral outlook for $SJM after a Negative over reaction following its earnings release placing the stock in drift C with an expected accuracy of 71.43%.

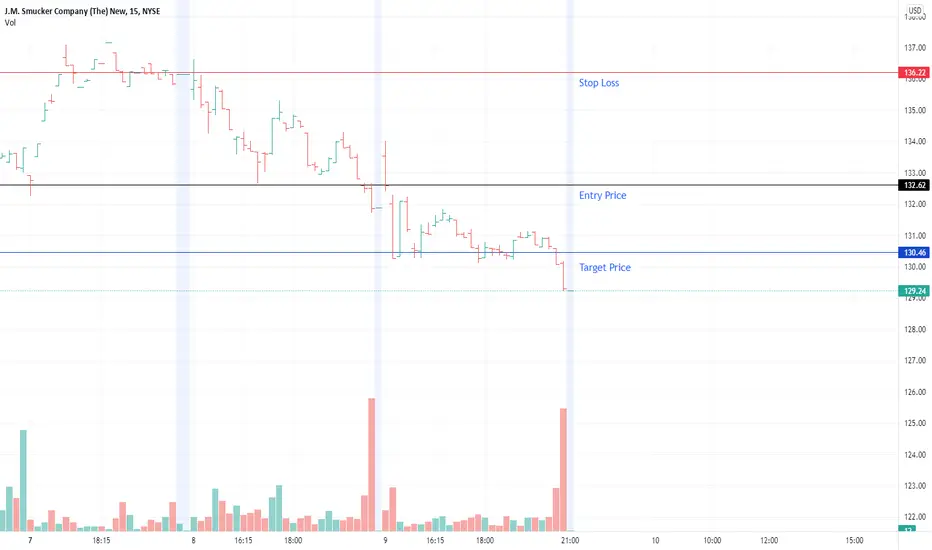
10/3/2022 NYSE (SJM)Short (Entry Price) below the black line and exit (Stop Loss) above the red line. Can take profit at the suggested Target Price.
Entry Price: $132.62
Target Price: $130.46
Stop Loss: $136.22
SJMIt looks like a cup with a handle. Whether there was a "handle" or there will still be a subjective question, but if the current week holds the level / the next Monday will be green, we can generally expect growth.
In general, the height can be the height of the cup (should be). But the size of the


LONG JM SMUCkERA; local favorite around here .. the JM SMUCKER company is paying a nice 3.0% yield on their div and has also formed a cup and handle pattern on the daily and looks like it's about to take off to break ATHs soon It had trouble breaking $135 last week, but it didn't crash like the rest of the marke

See all ideas
Trade directly on the supercharts through our supported, fully-verified and user-reviewed brokers.


Curated watchlists where SJM is featured.


Frequently Asked Questions
The current price of SJM is 111.10 USD — it has increased by 1.18% in the past 24 hours.
Depending on the exchange, the stock ticker may vary. For instance, on NYSE exchange The J.M. Smucker Company stocks are traded under the ticker SJM.
The J.M. Smucker Company is going to release the next earnings report on Jun 6, 2024. Keep track of upcoming events with our Earnings Calendar.
SJM stock is 1.61% volatile and has beta coefficient of 0.45. Check out the list of the most volatile stocks — is The J.M. Smucker Company there?
One year price forecast for The J.M. Smucker Company has a max estimate of 152.00 USD and a min estimate of 114.00 USD.
SJM earnings for the last quarter are 2.59 USD whereas the estimation was 2.47 USD which accounts for 4.88% surprise. Estimated earnings for the next quarter are 2.27 USD. See more details about The J.M. Smucker Company earnings.
The J.M. Smucker Company revenue for the last quarter amounts to 1.94 B USD despite the estimated figure of 1.95 B USD. In the next quarter revenue is expected to reach 2.22 B USD.
Yes, you can track The J.M. Smucker Company financials in yearly and quarterly reports right on TradingView.
SJM stock has fallen by 2.53% compared to the previous week, the month change is a 9.71% fall, over the last year The J.M. Smucker Company has showed a 27.60% decrease.
SJM net income for the last quarter is 120.40 M USD, while the quarter before that showed 194.80 M USD of net income which accounts for −38.19% change. Track more The J.M. Smucker Company financial stats to get the full picture.
Today The J.M. Smucker Company has the market capitalization of 11.66 B, it has decreased by 5.79% over the last week.
Yes, SJM dividends are paid quarterly. The last dividend per share was 1.06 USD. As of today, Dividend Yield (TTM)% is 3.83%. Tracking The J.M. Smucker Company dividends might help you take more informed decisions.
Like other stocks, SJM shares are traded on stock exchanges, e.g. Nasdaq, Nyse, Euronext, and the easiest way to buy them is through an online stock broker. To do this, you need to open an account and follow a broker's procedures, then start trading. You can trade The J.M. Smucker Company stock right from TradingView charts — choose your broker and connect to your account.
As of Apr 19, 2024, the company has 5.80 K employees. See our rating of the largest employees — is The J.M. Smucker Company on this list?
Investing in stocks requires a comprehensive research: you should carefully study all the available data, e.g. company's financials, related news, and its technical analysis. So The J.M. Smucker Company technincal analysis shows the sell today, and its 1 week rating is sell. Since market conditions are prone to changes, it's worth looking a bit further into the future — according to the 1 month rating The J.M. Smucker Company stock shows the sell signal. See more of The J.M. Smucker Company technicals for a more comprehensive analysis.
If you're still not sure, try looking for inspiration in our curated watchlists.
If you're still not sure, try looking for inspiration in our curated watchlists.
We've gathered analysts' opinions on The J.M. Smucker Company future price: according to them, SJM price has a max estimate of 152.00 USD and a min estimate of 114.00 USD. Read a more detailed The J.M. Smucker Company forecast: see what analysts think of The J.M. Smucker Company and suggest that you do with its stocks.
EBITDA measures a company's operating performance, its growth signifies an improvement in the efficiency of a company. The J.M. Smucker Company EBITDA is 1.81 B USD, and current EBITDA margin is 18.51%. See more stats in The J.M. Smucker Company financial statements.