September Trades (REVG, BUY, 9.13-9.20, 10%)Rev Group, Inc. Reports Strong Third Quarter Results, Raises Fiscal 2023 Outlook
REV Group (REVG) reported earnings of $0.35 per share on revenue of $680.00 million for the fiscal third quarter ended July 2023. The consensus earnings estimate was $0.247 per share and revenue estimate was $627.17 m
4.09USD
45.30 MUSD
2.64 BUSD
48.98 M
About REV Group, Inc.
Sector
Industry
CEO
Mark Anthony Skonieczny
Website
Headquarters
Brookfield
Employees (FY)
6.72 K
Founded
2010
ISIN
US7495271071
FIGI
BBG00CSG01W9
REV Group, Inc. is a holding company, which engages in the design, manufacture, and distribution of specialty vehicles and related aftermarket parts and services. The company sells its products to municipalities, government agencies, private contractors, and industrial and commercial end users. It operates through the following segments: Fire and Emergency, Commercial, and Recreation. The Fire and Emergency segment offers fire apparatus and ambulance products. The Commercial segment is involved in the production of small Type A school buses, transit buses, terminal trucks, and sweepers under the Collins Bus, ENC, Capacity, and Lay-Mor brands. The Recreation segment covers motorized recreational vehicle and application trailers. The company was founded in August 2010 and is headquartered in Brookfield, WI.


MAYBE It's Time to Sell REV GROUP!Like, comment and subscribe to boost your trading!
**Disclaimer** the content on this analysis is subject to change at any time without notice, and is provided for the sole purpose of assisting traders to make independent investment decisions.

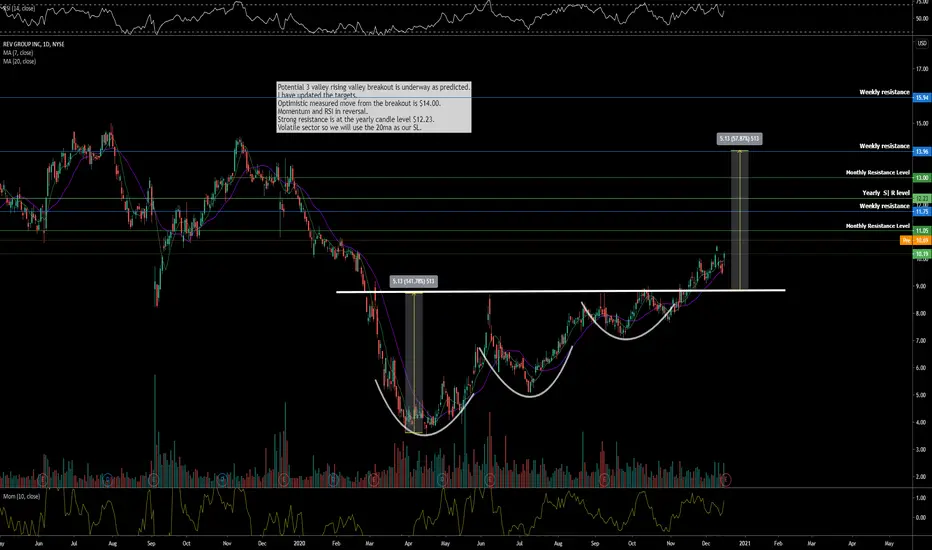
$REVG Rev Group 3 Valley pattern Breakout Underway. 🚗🚗
Potential 3 valley rising valley breakout is underway as predicted.
I have updated the targets.
Optimistic measured move from the breakout is $14.00.
Momentum and RSI in reversal.
Strong resistance is at the yearly candle level $12.23.
Volatile sector so we will use the 20ma as our SL.
$revg Rev Group on Breakout Watchlist
Potential 3 valley rising valley breakout,
alert set for breakout above $8.75
Targets as per chart.
RSI also in reversal and rising

REVG - Distribution Phase / Supply ZoneUp trend is broken and it looks like investers want to take profits home.
SHORT - MLHR
SL: 13.69 (Suggested by me)
TP: 11.79 (Suggested by me)
Please trade responsibly and good luck!

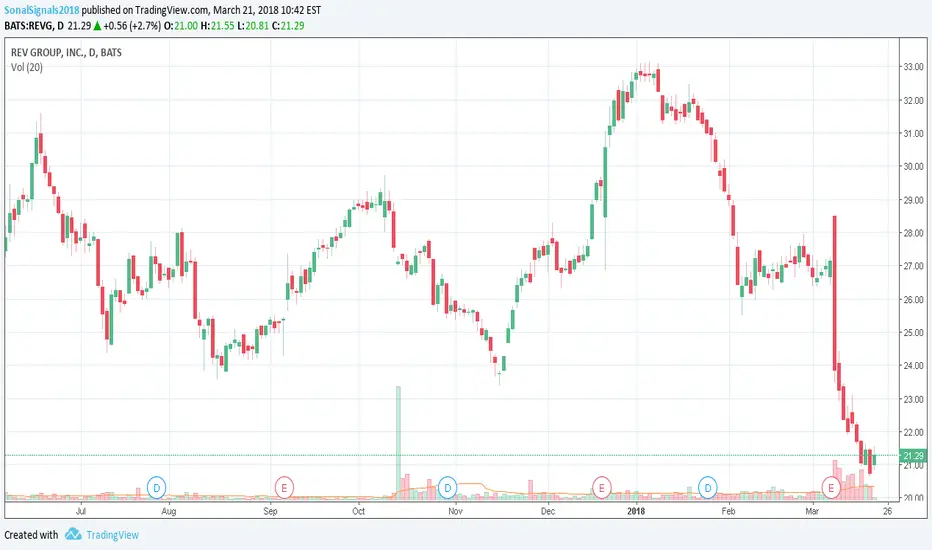
Bottom Fishing in REVGShares of REVG are at all-time lows and seem to have a favorable risk/reward ratio.
It's trading at about 14x 2017 earnings, and under 10x estimated 2018 earnings. They also have a 100% beat record (over 5 quarters as public company), so estimates may be conservative and imply an even greater valu

REVG Detected possible stock repurchase!!!REVG: rev group inc
2018-03-20 16:05:04
Detected possible stock repurchase
revg - swing trap with t30 setupNice looking swing trade setting up on revg which could be the start of wave 3. recently broke out from double bottom with good bullish momentum up 40% in just a couple of months and we have a chance to get in on the pullback here with Swing trap and t30 setup. sellers got in this stock which then t

See all ideas
Trade directly on the supercharts through our supported, fully-verified and user-reviewed brokers.


Frequently Asked Questions
The current price of REVG is 21.21 USD — it has increased by 0.28% in the past 24 hours.
Depending on the exchange, the stock ticker may vary. For instance, on NYSE exchange REV Group, Inc. stocks are traded under the ticker REVG.
REV Group, Inc. is going to release the next earnings report on Jun 5, 2024. Keep track of upcoming events with our Earnings Calendar.
REVG stock is 3.66% volatile and has beta coefficient of 0.72. Check out the list of the most volatile stocks — is REV Group, Inc. there?
One year price forecast for REV Group, Inc. has a max estimate of 28.00 USD and a min estimate of 20.00 USD.
REVG earnings for the last quarter are 0.53 USD per share, whereas the estimation was 0.34 USD resulting in a 55.88% surprise. The estimated earnings for the next quarter are 0.15 USD per share. See more details about REV Group, Inc. earnings.
REV Group, Inc. revenue for the last quarter amounts to 693.30 M USD despite the estimated figure of 666.13 M USD. In the next quarter revenue is expected to reach 579.42 M USD.
Yes, you can track REV Group, Inc. financials in yearly and quarterly reports right on TradingView.
REVG stock has fallen by 6.93% compared to the previous week, the month change is a 14.03% rise, over the last year REV Group, Inc. has showed a 86.54% increase.
REVG net income for the last quarter is 182.70 M USD, while the quarter before that showed 29.70 M USD of net income which accounts for 515.15% change. Track more REV Group, Inc. financial stats to get the full picture.
Today REV Group, Inc. has the market capitalization of 1.10 B, it has increased by 3.62% over the last week.
Yes, REVG dividends are paid quarterly. The last dividend per share was 0.05 USD. As of today, Dividend Yield (TTM)% is 0.95%. Tracking REV Group, Inc. dividends might help you take more informed decisions.
REV Group, Inc. dividend yield was 1.40% in 2023, and payout ratio reached 25.89%. The year before the numbers were 1.09% and 60.36% correspondingly. See high-dividend stocks and find more opportunities for your portfolio.
Like other stocks, REVG shares are traded on stock exchanges, e.g. Nasdaq, Nyse, Euronext, and the easiest way to buy them is through an online stock broker. To do this, you need to open an account and follow a broker's procedures, then start trading. You can trade REV Group, Inc. stock right from TradingView charts — choose your broker and connect to your account.
As of Apr 19, 2024, the company has 6.72 K employees. See our rating of the largest employees — is REV Group, Inc. on this list?
Investing in stocks requires a comprehensive research: you should carefully study all the available data, e.g. company's financials, related news, and its technical analysis. So REV Group, Inc. technincal analysis shows the neutral today, and its 1 week rating is buy. Since market conditions are prone to changes, it's worth looking a bit further into the future — according to the 1 month rating REV Group, Inc. stock shows the buy signal. See more of REV Group, Inc. technicals for a more comprehensive analysis.
If you're still not sure, try looking for inspiration in our curated watchlists.
If you're still not sure, try looking for inspiration in our curated watchlists.
We've gathered analysts' opinions on REV Group, Inc. future price: according to them, REVG price has a max estimate of 28.00 USD and a min estimate of 20.00 USD. Read a more detailed REV Group, Inc. forecast: see what analysts think of REV Group, Inc. and suggest that you do with its stocks.
EBITDA measures a company's operating performance, its growth signifies an improvement in the efficiency of a company. REV Group, Inc. EBITDA is 143.40 M USD, and current EBITDA margin is 5.00%. See more stats in REV Group, Inc. financial statements.