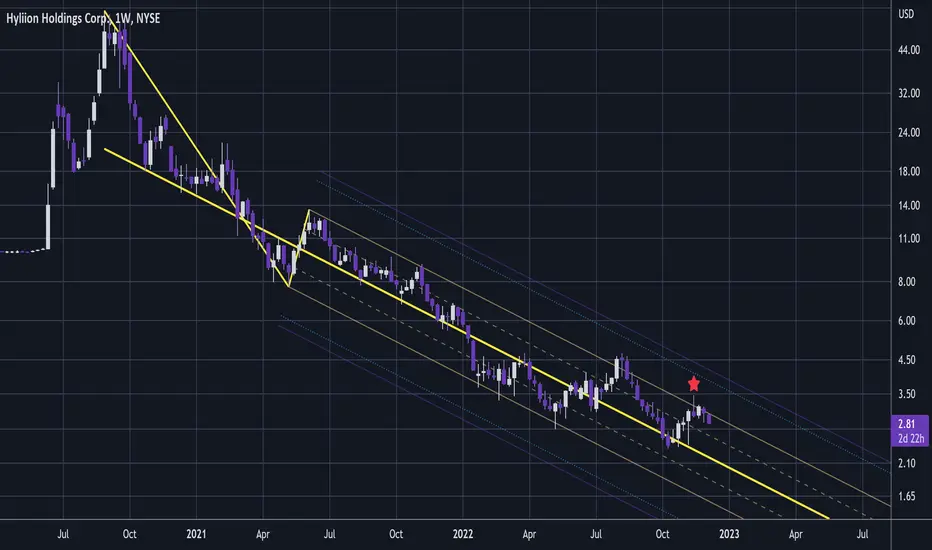
HYLN LongLots of patterns here whatever you want to call it:
1, cup and handle
2, breakout followed by retest
3, pullback after latest swing
Atleast 1 r/r
−0.68USD
−123.51 MUSD
672.00 KUSD
124.19 M
About Hyliion Holdings Corp.
Sector
Industry
CEO
Thomas J. Healy
Website
Headquarters
Cedar Park
Employees (FY)
85
Founded
2015
ISIN
US4491091074
FIGI
BBG00N9MJTZ9
Hyliion Holdings Corp. manufactures hybrid and electric powertrains for trucks. It engages in the provision of hybrid technology to tractor trailers. The company was founded by Thomas Healy in 2015 and is headquartered in Cedar Park, TX.

$HYLN Ready for LIFTOFFAt this time #HYLN just received CA CARB compliance in conjuction with NYSE:CMI #CMI Cummins Natural Gas engine and HYLN Electrified Powertrain enabling up to 75 miles of pure electric transportation. Outside of mandatory port of LA for example the software can switch over to Hybrid platform. Al

HYLN SHORTComparing to Companies Like Plug And Daimler Trucking I just don't see hyliion trending up anytime soon.
2.7 or lower for NYSE:HYLN
$27/$25 Target For NASDAQ:PLUG

HYLN - Pitchfork Elevator Ride 🙀😾It got a bit exciting in EV for a minute or two and HYLN had a flurry upward, but just to show you in terms of trend really nothing has happened and that shooting star through the green upper median line is bearish, shows another leg down coming.
Who know where the bottom is really, I have fib ta
HYLN - Super Deep Value Projection 😮I had thought HYLN would bottom around the 1:0.618 but it already appears that it will continue on with following this weekly close. Its a bit early to say but the next fib group looks on the cards for a long range 1:1 fib target @ $1.78! 😮
From one of these fibs a BIG bounce is coming I think.
RS

Hyln Bullish IdeaHyln cleared the 20 ema on the daily chart. Also, it closed above a strong resistance on the 4 hour. This gave us enough confidence to go long. - HH


Signs of being near to the end of the bear cycle.I think one of the most important things in trading is to realize what stage of the market cycle you are in. I got in on HYLN at $20 and I got out at $53. A friend of mine shamed me for "pannick selling" so I bought back in and got out again finally at $43. The 3 descending lines are simply projecti

HYLN - Is A BUY At $3 🔥Some fib and RSI work here and I think HYLN's anchoring long range fib will be the 1:0.618 @ $4 and I've drawn short range fibs to estimate the overshoot down to $3.
In that area RSI will likely be somewhere around its ATL of 27, maybe it will be an RSI fakeout to dip slightly below.
I'll be selli

Hyliion Hldg Corp Cl A (HYLN)Hyliion Hldg Corp Cl A (HYLN)
$HYLN Really believe in this company’s technology and 2022 should be a big year.
Based on 4 Wall Street analysts offering 12 month price targets for Hyliion Holdings in the last 3 months. The average price target is $7.83 with a high forecast of $12.00 and a low fore

See all ideas
Trade directly on the supercharts through our supported, fully-verified and user-reviewed brokers.


Curated watchlists where HYLN is featured.

Frequently Asked Questions
The current price of HYLN is 1.36 USD — it has increased by 2.26% in the past 24 hours.
Depending on the exchange, the stock ticker may vary. For instance, on NYSE exchange Hyliion Holdings Corp. stocks are traded under the ticker HYLN.
Hyliion Holdings Corp. is going to release the next earnings report on May 7, 2024. Keep track of upcoming events with our Earnings Calendar.
HYLN stock is 5.97% volatile and has beta coefficient of 2.15. Check out the list of the most volatile stocks — is Hyliion Holdings Corp. there?
One year price forecast for Hyliion Holdings Corp. has a max estimate of 1.50 USD and a min estimate of 1.50 USD.
HYLN earnings for the last quarter are −0.17 USD whereas the estimation was −0.18 USD which accounts for 4.23% surprise. Estimated earnings for the next quarter are −0.11 USD. See more details about Hyliion Holdings Corp. earnings.
Hyliion Holdings Corp. revenue for the last quarter amounts to 266.00 K USD despite the estimated figure of 476.00 K USD. In the next quarter revenue is expected to reach 346.67 K USD.
Yes, you can track Hyliion Holdings Corp. financials in yearly and quarterly reports right on TradingView.
HYLN stock has fallen by 6.21% compared to the previous week, the month change is a 15.00% fall, over the last year Hyliion Holdings Corp. has showed a 17.07% decrease.
HYLN net income for the last quarter is −29.13 M USD, while the quarter before that showed −30.32 M USD of net income which accounts for 3.93% change. Track more Hyliion Holdings Corp. financial stats to get the full picture.
Today Hyliion Holdings Corp. has the market capitalization of 249.16 M, it has decreased by 14.77% over the last week.
No, HYLN doesn't pay any dividends to its shareholders. But don't worry, we've prepared a list of high-dividend stocks for you.
Like other stocks, HYLN shares are traded on stock exchanges, e.g. Nasdaq, Nyse, Euronext, and the easiest way to buy them is through an online stock broker. To do this, you need to open an account and follow a broker's procedures, then start trading. You can trade Hyliion Holdings Corp. stock right from TradingView charts — choose your broker and connect to your account.
As of Apr 18, 2024, the company has 85.00 employees. See our rating of the largest employees — is Hyliion Holdings Corp. on this list?
Investing in stocks requires a comprehensive research: you should carefully study all the available data, e.g. company's financials, related news, and its technical analysis. So Hyliion Holdings Corp. technincal analysis shows the neutral today, and its 1 week rating is sell. Since market conditions are prone to changes, it's worth looking a bit further into the future — according to the 1 month rating Hyliion Holdings Corp. stock shows the sell signal. See more of Hyliion Holdings Corp. technicals for a more comprehensive analysis.
If you're still not sure, try looking for inspiration in our curated watchlists.
If you're still not sure, try looking for inspiration in our curated watchlists.
We've gathered analysts' opinions on Hyliion Holdings Corp. future price: according to them, HYLN price has a max estimate of 1.50 USD and a min estimate of 1.50 USD. Read a more detailed Hyliion Holdings Corp. forecast: see what analysts think of Hyliion Holdings Corp. and suggest that you do with its stocks.
EBITDA measures a company's operating performance, its growth signifies an improvement in the efficiency of a company. Hyliion Holdings Corp. EBITDA is −122.38 M USD, and current EBITDA margin is −18.21 K%. See more stats in Hyliion Holdings Corp. financial statements.