CMS: mean reversion tradeA price action above 55.50 supports a bullish trend direction.
Further bullish confirmation for a break above 57.00.
The target price is set at 58.50 (200-week simple moving average).
Also just above the mean of the linear regression channel pattern.
The stop-loss price is set at 54.40 (lower range
3.00USD
887.00 MUSD
7.46 BUSD
296.86 M
About CMS Energy Corporation
Sector
Industry
CEO
Garrick J. Rochow
Website
Headquarters
Jackson
Employees (FY)
8.36 K
Founded
1987
ISIN
US1258961002
FIGI
BBG000BFVXX0
CMS Energy Corp. engages in the provision of electric and natural gas activities. It operates through the following business segments: Electric Utility, Gas Utility, and NorthStar Clean Energy. The Electric Utility segment focuses on generation, purchase, distribution, and sale of electricity. The Gas Utility segment includes purchase, transmission, storage, distribution, and sale of natural gas. The NorthStar Clean Energy segment is involved in domestic independent power production including the development and operation of renewable generation and the marketing of independent power production. The company was founded in 1987 and is headquartered in Jackson, MI.

$CMS with a Bullish outlook following its earnings #Stocks The PEAD projected a Bullish outlook for $CMS after a Positive Under reaction following its earnings release placing the stock in drift A with an expected accuracy of 50%.

$CMS with a Bullish outlook following its earnings #Stocks The PEAD projected a Bullish outlook for $CMS after a Positive Under reaction following its earnings release placing the stock in drift A with an expected accuracy of 33.33%.

CMS New All Time HighsCMS made another New All Time High on Friday
2 Year Long Base
Price above 200 DMA
Pays out Dividends

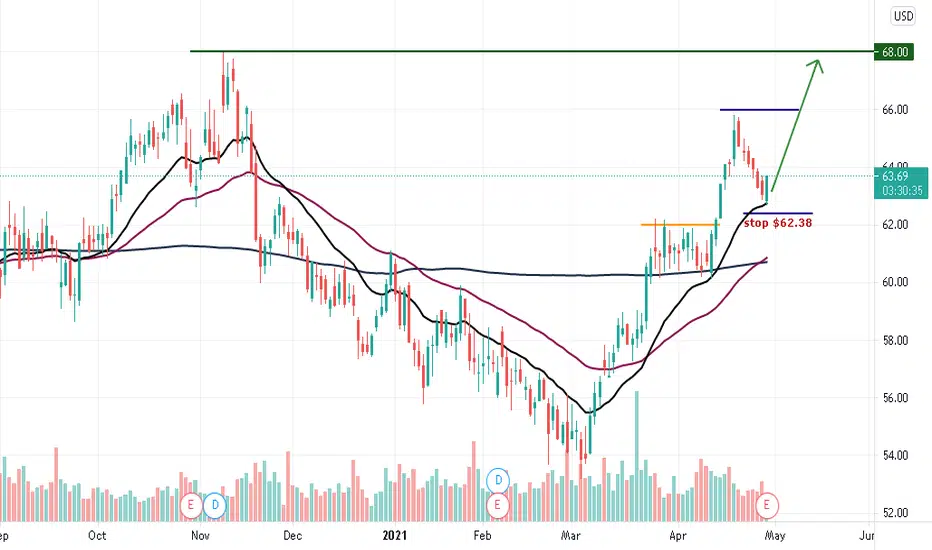
Power of EMA20 and good earnings report The stock holds EMA20 and bouncing back, I'm gonna enter into a lnog position with the strong support $62.38. Price action shows that it's gonna go higher after break above resistance! Good risk/reward ratio!
CMS ENERGY CORP is to BUY DailyHey traders, CMS ENERGY CORP is in a bullish push, CMS ENERGY CORP is heading for its latest high. It can turn around if the sellers are back to start falling, or either it's the buyers co-ordinating the price, to push up on decision and price areas.
Please LIKE & FOLLOW, thank you!

CMCSA - DAILY CHARTHi, today we are going to talk about the Comcast Corporation and its current landscape.
Comcast Corporation enters in the spotlight of the market as T- Mobile has announced that John Legere will leave the seat of CEO of the company, been replaced by Mike Sievert in April 2020. The former CEO that ha

CMS: Sort opportunityAn intraday high potential, Back Tested Sort Analysis.
We ll try to enter into the correction of the uptrend movement.
DETAILS ON THE CHART
NOTE: Entry range area above the entry point, is calculated upon 80% of the recorded pullback back tested past performances
DISCLAIMER: This is a te

$CMS - The fucking TA I live for Son there's something up w/ the market with the types of charts I'm seeing. I wouldn't consider getting long on SHIT until after today. 6 months I've gone without seeing any familiar setup that gets chewed up & flushed out just to stage a fake rally but - there must be some type of life in the marke

Bearish SharkBearish Shark with bearish divergence. The BC extension is a little off, but overall a great looking pattern!

See all ideas
Trade directly on the supercharts through our supported, fully-verified and user-reviewed brokers.


Frequently Asked Questions
The current price of CMS is 59.43 USD — it has increased by 1.62% in the past 24 hours.
Depending on the exchange, the stock ticker may vary. For instance, on NYSE exchange CMS Energy Corporation stocks are traded under the ticker CMS.
CMS Energy Corporation is going to release the next earnings report on Apr 25, 2024. Keep track of upcoming events with our Earnings Calendar.
CMS stock is 2.04% volatile and has beta coefficient of 0.35. Check out the list of the most volatile stocks — is CMS Energy Corporation there?
One year price forecast for CMS Energy Corporation has a max estimate of 67.00 USD and a min estimate of 55.00 USD.
CMS earnings for the last quarter are 0.61 USD per share, whereas the estimation was 0.59 USD resulting in a 3.95% surprise. The estimated earnings for the next quarter are 1.04 USD per share. See more details about CMS Energy Corporation earnings.
CMS Energy Corporation revenue for the last quarter amounts to 1.67 B USD despite the estimated figure of 2.11 B USD. In the next quarter revenue is expected to reach 2.62 B USD.
Yes, you can track CMS Energy Corporation financials in yearly and quarterly reports right on TradingView.
CMS stock has risen by 2.66% compared to the previous week, the month change is a 1.94% rise, over the last year CMS Energy Corporation has showed a 3.88% decrease.
CMS net income for the last quarter is 309.00 M USD, while the quarter before that showed 176.00 M USD of net income which accounts for 75.57% change. Track more CMS Energy Corporation financial stats to get the full picture.
Today CMS Energy Corporation has the market capitalization of 17.46 B, it has decreased by 1.83% over the last week.
Yes, CMS dividends are paid quarterly. The last dividend per share was 0.51 USD. As of today, Dividend Yield (TTM)% is 3.38%. Tracking CMS Energy Corporation dividends might help you take more informed decisions.
CMS Energy Corporation dividend yield was 3.36% in 2023, and payout ratio reached 64.86%. The year before the numbers were 2.91% and 64.52% correspondingly. See high-dividend stocks and find more opportunities for your portfolio.
Like other stocks, CMS shares are traded on stock exchanges, e.g. Nasdaq, Nyse, Euronext, and the easiest way to buy them is through an online stock broker. To do this, you need to open an account and follow a broker's procedures, then start trading. You can trade CMS Energy Corporation stock right from TradingView charts — choose your broker and connect to your account.
As of Apr 19, 2024, the company has 8.36 K employees. See our rating of the largest employees — is CMS Energy Corporation on this list?
Investing in stocks requires a comprehensive research: you should carefully study all the available data, e.g. company's financials, related news, and its technical analysis. So CMS Energy Corporation technincal analysis shows the buy rating today, and its 1 week rating is buy. Since market conditions are prone to changes, it's worth looking a bit further into the future — according to the 1 month rating CMS Energy Corporation stock shows the buy signal. See more of CMS Energy Corporation technicals for a more comprehensive analysis.
If you're still not sure, try looking for inspiration in our curated watchlists.
If you're still not sure, try looking for inspiration in our curated watchlists.
We've gathered analysts' opinions on CMS Energy Corporation future price: according to them, CMS price has a max estimate of 67.00 USD and a min estimate of 55.00 USD. Read a more detailed CMS Energy Corporation forecast: see what analysts think of CMS Energy Corporation and suggest that you do with its stocks.
EBITDA measures a company's operating performance, its growth signifies an improvement in the efficiency of a company. CMS Energy Corporation EBITDA is 2.42 B USD, and current EBITDA margin is 32.36%. See more stats in CMS Energy Corporation financial statements.