BBDC - Daily - Earnings PlayClick Here🖱️ and scroll down👇 for the technicals, and more behind this trade!!!
________________________________________________________
________________________________________________________
========================
.................✋NFA👍..................
========================
📈Technical/Fu
1.19USD
128.00 MUSD
222.29 MUSD
105.44 M
About Barings BDC, Inc.
Sector
Industry
CEO
Eric J. Lloyd
Website
Headquarters
Charlotte
Founded
2006
ISIN
US06759L1035
FIGI
BBG000F54FK1
Barings BDC, Inc., a traded fund, seeks investment opportunities in middle-market companies located in the United States with an EBITDA ranging from $5 - $75 million and revenues between $20 and $300 million. The fund targets companies operating in energy minerals, distribution services, health services, consumer services, transportation and communication. It provides financing in the form of debt, mezzanine and equity for debt, mezzanine, growth, buyout, LBO and MBO capital requirements with an investment size ranging from $5 - $50 million. It acts as co-investor and takes minority interest. The company is headquartered in Charlotte, NC.

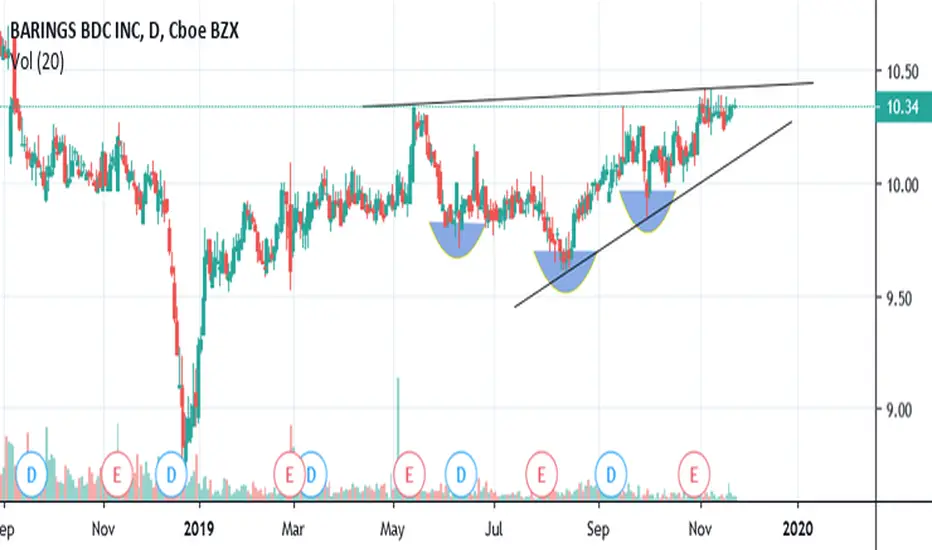
BBDC Break OutYesterday's candle managed to close above the trend line after testing the .382 fib level. With price in close proximity to the YTD POC line and the recent MACD cross I think this is ready to break out.
target: $10.52, $10.92, $11.24

$BBDC Looks good here, somewhat IHS, and tightening wedge.Plenty of buy volume somewhat back, but still important. A nice tightening wedge towards the end, looks bullish imo.
See all ideas
Trade directly on the supercharts through our supported, fully-verified and user-reviewed brokers.


Frequently Asked Questions
The current price of BBDC is 9.23 USD — it has decreased by 0.22% in the past 24 hours.
Depending on the exchange, the stock ticker may vary. For instance, on NYSE exchange Barings BDC, Inc. stocks are traded under the ticker BBDC.
Barings BDC, Inc. is going to release the next earnings report on May 7, 2024. Keep track of upcoming events with our Earnings Calendar.
BBDC stock is 0.54% volatile and has beta coefficient of 0.62. Check out the list of the most volatile stocks — is Barings BDC, Inc. there?
One year price forecast for Barings BDC, Inc. has a max estimate of 11.00 USD and a min estimate of 9.00 USD.
BBDC earnings for the last quarter are 0.31 USD per share, whereas the estimation was 0.32 USD resulting in a −1.78% surprise. The estimated earnings for the next quarter are 0.30 USD per share. See more details about Barings BDC, Inc. earnings.
Barings BDC, Inc. revenue for the last quarter amounts to 70.85 M USD despite the estimated figure of 74.06 M USD. In the next quarter revenue is expected to reach 71.97 M USD.
Yes, you can track Barings BDC, Inc. financials in yearly and quarterly reports right on TradingView.
BBDC stock has fallen by 1.60% compared to the previous week, the month change is a 1.65% rise, over the last year Barings BDC, Inc. has showed a 21.29% increase.
BBDC net income for the last quarter is 29.91 M USD, while the quarter before that showed 18.32 M USD of net income which accounts for 63.26% change. Track more Barings BDC, Inc. financial stats to get the full picture.
Today Barings BDC, Inc. has the market capitalization of 981.12 M, it has increased by 0.33% over the last week.
Yes, BBDC dividends are paid quarterly. The last dividend per share was 0.26 USD. As of today, Dividend Yield (TTM)% is 11.14%. Tracking Barings BDC, Inc. dividends might help you take more informed decisions.
Barings BDC, Inc. dividend yield was 11.89% in 2023, and payout ratio reached 85.30%. The year before the numbers were 11.66% and 2.09 K% correspondingly. See high-dividend stocks and find more opportunities for your portfolio.
Like other stocks, BBDC shares are traded on stock exchanges, e.g. Nasdaq, Nyse, Euronext, and the easiest way to buy them is through an online stock broker. To do this, you need to open an account and follow a broker's procedures, then start trading. You can trade Barings BDC, Inc. stock right from TradingView charts — choose your broker and connect to your account.
Investing in stocks requires a comprehensive research: you should carefully study all the available data, e.g. company's financials, related news, and its technical analysis. So Barings BDC, Inc. technincal analysis shows the neutral today, and its 1 week rating is buy. Since market conditions are prone to changes, it's worth looking a bit further into the future — according to the 1 month rating Barings BDC, Inc. stock shows the neutral signal. See more of Barings BDC, Inc. technicals for a more comprehensive analysis.
If you're still not sure, try looking for inspiration in our curated watchlists.
If you're still not sure, try looking for inspiration in our curated watchlists.
We've gathered analysts' opinions on Barings BDC, Inc. future price: according to them, BBDC price has a max estimate of 11.00 USD and a min estimate of 9.00 USD. Read a more detailed Barings BDC, Inc. forecast: see what analysts think of Barings BDC, Inc. and suggest that you do with its stocks.
EBITDA measures a company's operating performance, its growth signifies an improvement in the efficiency of a company. Barings BDC, Inc. EBITDA is 217.63 M USD, and current EBITDA margin is 100.60%. See more stats in Barings BDC, Inc. financial statements.