SCHAND IPO based strategyPaper Stocks Buzzing-National Education Policy In Focus:
NEP Implementation Underway+Pulp Paper Rising+Pre-order for packaging to start for festive season+Sustained demand from offices as WFH wanes off+FYI Paper stock prices still at elevated levels. Q2 may be mixed.
Incorporated in 1970 and list
8.65INR
660.36 MINR
6.10 BINR
13.03 M
About S CHAND AND COMPAN
Sector
CEO
Himanshu Gupta
Headquarters
New Delhi
Website
Employees (FY)
1.8 K
Founded
1939
ISIN
INE807K01035
FIGI
BBG00GH812P5
S Chand & Co. Ltd. engages in publishing and trading educational books. It operates through the Domestic and Overseas geographical segments. The company was founded by Shyam Lal Gupta in 1939 and is headquartered in New Delhi, India.
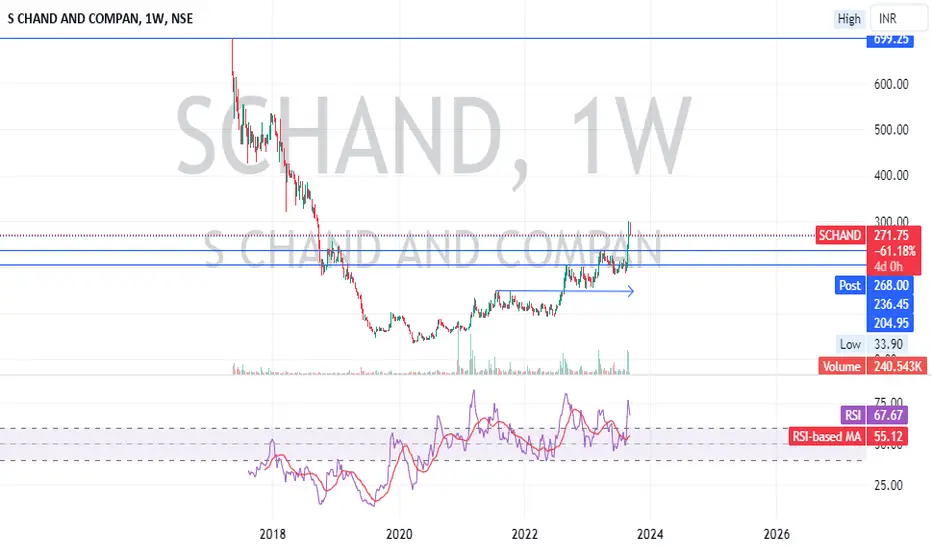
Triangle Pattern Breakout (Weekly TF) - SCHANDPlease look into the chart for a detailed understanding.
Consider these for short-term & swing trades with 4% profit (In my observation, I found that most of the stocks reached 3% to 4% on weekly basis)
Please consider these ideas for educational purposes.

targeted breakout all ready chart noted for the target
no recommendation for buy and sell.
Incorporated in 1970 and listed in 2016, S Chand & Company is principally engaged in publishing educational books with products ranging from school books, higher academic books, competition and reference books, technical and

SCHAND...Cmp - 206...Keep an eye for upmoveSCHAND
Cmp- 206
Stop- 171
T1- 471
T2- Open, Review at T1
Expected Holding Period- 9-12 Months
View- Swing/Investment

SCHANDLooking good for 250/350 target if break 220
Disclaimer- view shared if education purposes only

Necklace Pattern Trading - "S Chand & Company"This has been highly dependable stock since last 1 month. When benchmark Index "Nifty" fell by 500 points, this stock was rock solid holding its swing high level & stayed in the range of just 20 points. This is my Necklace Pattern stock it will be interesting to see how story unfolds when it reaches

SCHAND triple bottom breakout with volumeCMP 214.60
Recent Results : Growth in Operating Profit with increase in operating margins (YoY)
Near 52 Week High
Stock gained more than 20% in one month
Strong Momentum: Price above short, medium and long term moving averages
Highest Recovery from 52 Week Low
*Not recommendation. Do y

High Volume BreakoutWhen price consolidate after a uptrend and break the upper boundary then high probability price continue the tren .

How i made significant return by Swing trading with in weeksAll the reasons for the trade have been explained in the video, Hope this video add some value in your trading.

S chand & co.S. chand & co.104/114 and above may move 149/155 medium term .from 94. D. side may be 74.( chart for education purpose.)

See all ideas
Trade directly on the supercharts through our supported, fully-verified and user-reviewed brokers.


Frequently Asked Questions
The current price of SCHAND is 228.60 INR — it has decreased by 2.01% in the past 24 hours.
Depending on the exchange, the stock ticker may vary. For instance, on NSE exchange S CHAND AND COMPAN stocks are traded under the ticker SCHAND.
S CHAND AND COMPAN is going to release the next earnings report on May 29, 2024. Keep track of upcoming events with our Earnings Calendar.
SCHAND stock is 2.46% volatile and has beta coefficient of 0.13. Check out the list of the most volatile stocks — is S CHAND AND COMPAN there?
One year price forecast for S CHAND AND COMPAN has a max estimate of 315.00 INR and a min estimate of 315.00 INR.
SCHAND earnings for the last quarter are −17.20 INR whereas the estimation was −17.20 INR which accounts for 0% surprise. Estimated earnings for the next quarter are −21.40 INR. See more details about S CHAND AND COMPAN earnings.
S CHAND AND COMPAN revenue for the last quarter amounts to 380.00 M INR despite the estimated figure of 380.00 M INR. In the next quarter revenue is expected to reach 656.00 M INR.
Yes, you can track S CHAND AND COMPAN financials in yearly and quarterly reports right on TradingView.
SCHAND stock has fallen by 7.56% compared to the previous week, the month change is a 6.88% fall, over the last year S CHAND AND COMPAN has showed a 5.71% increase.
SCHAND net income for the last quarter is −348.89 M INR, while the quarter before that showed −403.17 M INR of net income which accounts for 13.46% change. Track more S CHAND AND COMPAN financial stats to get the full picture.
Today S CHAND AND COMPAN has the market capitalization of 8.21 B, it has decreased by 1.51% over the last week.
Yes, SCHAND dividends are paid annually. The last dividend per share was 3.00 INR. As of today, Dividend Yield (TTM)% is 1.29%. Tracking S CHAND AND COMPAN dividends might help you take more informed decisions.
S CHAND AND COMPAN dividend yield was 1.35% in 2022, and payout ratio reached 15.94%. The year before the numbers were 0% and 0% correspondingly. See high-dividend stocks and find more opportunities for your portfolio.
Like other stocks, SCHAND shares are traded on stock exchanges, e.g. Nasdaq, Nyse, Euronext, and the easiest way to buy them is through an online stock broker. To do this, you need to open an account and follow a broker's procedures, then start trading. You can trade S CHAND AND COMPAN stock right from TradingView charts — choose your broker and connect to your account.
As of Apr 19, 2024, the company has 1.80 K employees. See our rating of the largest employees — is S CHAND AND COMPAN on this list?
Investing in stocks requires a comprehensive research: you should carefully study all the available data, e.g. company's financials, related news, and its technical analysis. So S CHAND AND COMPAN technincal analysis shows the sell today, and its 1 week rating is sell. Since market conditions are prone to changes, it's worth looking a bit further into the future — according to the 1 month rating S CHAND AND COMPAN stock shows the buy signal. See more of S CHAND AND COMPAN technicals for a more comprehensive analysis.
If you're still not sure, try looking for inspiration in our curated watchlists.
If you're still not sure, try looking for inspiration in our curated watchlists.
We've gathered analysts' opinions on S CHAND AND COMPAN future price: according to them, SCHAND price has a max estimate of 315.00 INR and a min estimate of 315.00 INR. Read a more detailed S CHAND AND COMPAN forecast: see what analysts think of S CHAND AND COMPAN and suggest that you do with its stocks.
EBITDA measures a company's operating performance, its growth signifies an improvement in the efficiency of a company. S CHAND AND COMPAN EBITDA is 701.62 M INR, and current EBITDA margin is 17.55%. See more stats in S CHAND AND COMPAN financial statements.