Vroom (VRM)On the above 10-day chart price action has corrected a whopping 80% since July. The correction follows the 200% move that printed from May this year, idea below. The majority that have sold since July did so at a loss. Now is an excellent long moment. Why?
1) Price action, RSI, MFI resistance break
−209.42USD
−365.54 MUSD
893.20 MUSD
1.54 M
About Vroom, Inc.
Sector
Industry
CEO
Thomas H. Shortt
Website
Headquarters
Houston
Employees (FY)
1.68 K
Founded
2012
ISIN
US92918V2088
FIGI
BBG009NGKQ45
Vroom, Inc. engages in providing an ecommerce platform for the buying and selling of used vehicles. The company operates through the following segments: Ecommerce, Texas Direct Auto (TDA) and Wholesale. The Ecommerce segment represents retail sales of used vehicles through its ecommerce platform and fees earned on sales of value-added products associated with those vehicles sales. The TDA segment handles retail sales of used vehicles from TDA and fees earned on sales of value-added products associated with those vehicles sales. The Wholesale segment is involved in sales of used vehicles through wholesale auctions. The company was founded in 2012 and is headquartered in Houston, TX.
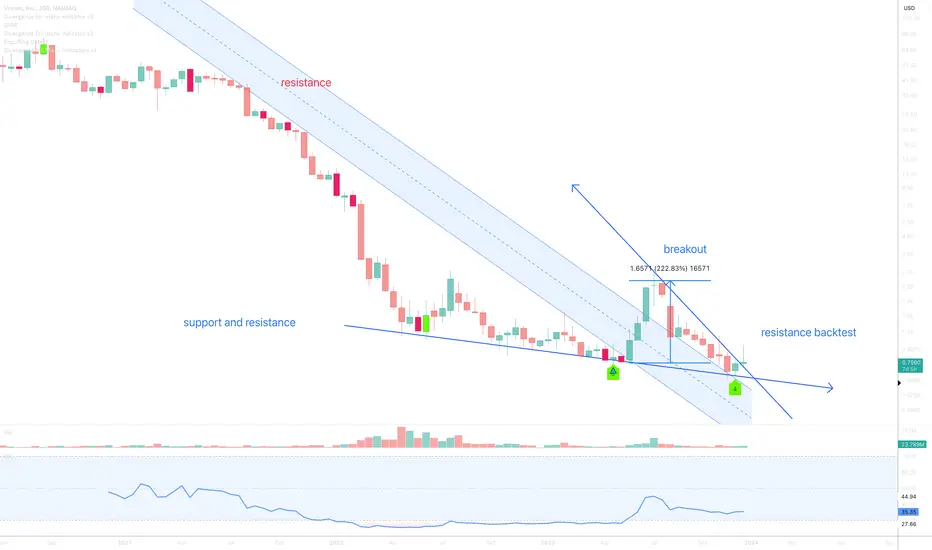
Vroom (VRM)On the above 10-day chart price action has corrected 98% since 2021. Now is an excellent long moment. Why?
1) You know why.
2) Price action, RSI, MFI resistance breakouts.
3) Bullish divergence. Lots of it. 9 oscillators are printing positive divergence with price action.
4) No stock splits.
5

VRMMID-TERM: Shark and Wedge with hidden bullish divergence near the 200 day SMA. (not financial advice)

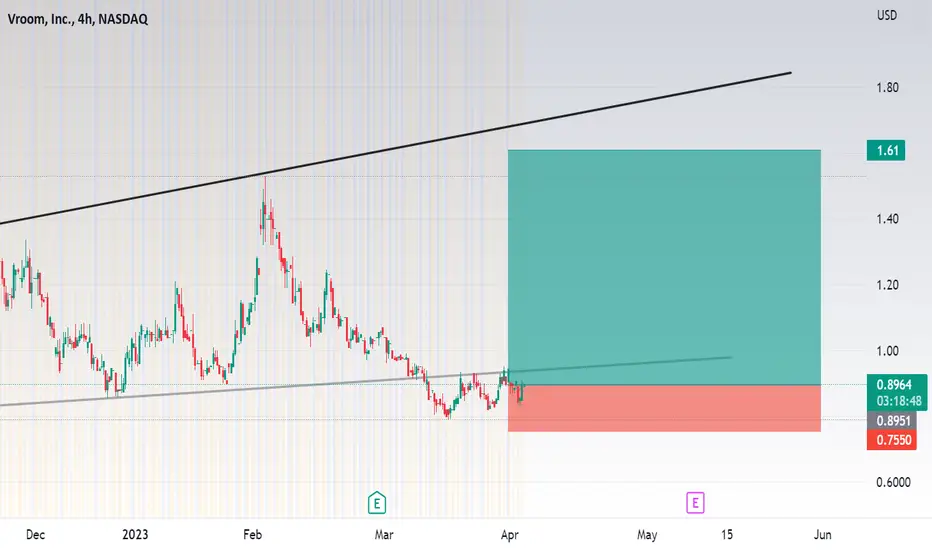
VRM Vroom 2X Upside PotentialIf you haven`t bought VRM here:
Now VRM, Vroom, with its recent gap at the $4.50 - $5.10 level, presents an intriguing opportunity for investors.
Historical data indicates that gaps tend to fill 80% of the time, making this gap a potential target for short-term traders and investors.
The gap act


$VRM Riding The WaveUp 46% with the Carvana (NYSE: CVNA) rally, Vroom, Inc. (NASDAQ: VRM) seems to be in a good position, especially since used car prices increased in April. Furthermore, with the FOMC approaching and the expectations that the Fed is going to pause rate hikes VRM can expect to increase its sales with t

VRM buy set up Institutions controlling the price and made a fake breakout. I expect price to come back up for a potential of 75% gain
vroom Final phase before stock split☢️🔻⚠️☢️🔻As per the last 10k Filing .
This is so bad and don't invest in the stock right now.
You will lose money!
One final way to make money is short it if it goes high. If it goes 10 -20% short it 1x Leverage, 50-100% short it 5x or 10x leverage.
Don't long on this one. Past 900 days this stock is pure

🔻Vroom Market maker move prediction🔻Vroom market maker movement will be following either of this option
Option 2 is mostly going to happen according to Nasdaq. Long only from the floor. Wait for the Proxy statement if RS is going to happen.
Short this !!🔻🔻🔻
NFA

VROOM is going to be like this🔻🔻🔻🔻🔻🔻The floor will be around this area I marked. All of the indicators are going down!!! MACD RSI🔻
Wait till the floor for entry

See all ideas
Trade directly on the supercharts through our supported, fully-verified and user-reviewed brokers.


Frequently Asked Questions
The current price of VRM is 10.94 USD — it has decreased by 1.17% in the past 24 hours.
Depending on the exchange, the stock ticker may vary. For instance, on NASDAQ exchange Vroom, Inc. stocks are traded under the ticker VRM.
Vroom, Inc. is going to release the next earnings report on May 7, 2024. Keep track of upcoming events with our Earnings Calendar.
VRM stock is 5.31% volatile and has beta coefficient of 3.03. Check out the list of the most volatile stocks — is Vroom, Inc. there?
VRM earnings for the last quarter are −47.20 USD whereas the estimation was −35.93 USD which accounts for −31.36% surprise. Estimated earnings for the next quarter are −29.60 USD. See more details about Vroom, Inc. earnings.
Vroom, Inc. revenue for the last quarter amounts to 235.63 M USD despite the estimated figure of 244.11 M USD. In the next quarter revenue is expected to reach 232.00 M USD.
Yes, you can track Vroom, Inc. financials in yearly and quarterly reports right on TradingView.
VRM stock has fallen by 9.59% compared to the previous week, the month change is a 1.62% fall, over the last year Vroom, Inc. has showed a 84.97% decrease.
VRM net income for the last quarter is −141.32 M USD, while the quarter before that showed −82.86 M USD of net income which accounts for −70.56% change. Track more Vroom, Inc. financial stats to get the full picture.
Today Vroom, Inc. has the market capitalization of 19.87 M, it has increased by 2.19% over the last week.
No, VRM doesn't pay any dividends to its shareholders. But don't worry, we've prepared a list of high-dividend stocks for you.
Like other stocks, VRM shares are traded on stock exchanges, e.g. Nasdaq, Nyse, Euronext, and the easiest way to buy them is through an online stock broker. To do this, you need to open an account and follow a broker's procedures, then start trading. You can trade Vroom, Inc. stock right from TradingView charts — choose your broker and connect to your account.
As of Apr 19, 2024, the company has 1.68 K employees. See our rating of the largest employees — is Vroom, Inc. on this list?
Investing in stocks requires a comprehensive research: you should carefully study all the available data, e.g. company's financials, related news, and its technical analysis. So Vroom, Inc. technincal analysis shows the sell today, and its 1 week rating is sell. Since market conditions are prone to changes, it's worth looking a bit further into the future — according to the 1 month rating Vroom, Inc. stock shows the sell signal. See more of Vroom, Inc. technicals for a more comprehensive analysis.
If you're still not sure, try looking for inspiration in our curated watchlists.
If you're still not sure, try looking for inspiration in our curated watchlists.
EBITDA measures a company's operating performance, its growth signifies an improvement in the efficiency of a company. Vroom, Inc. EBITDA is −170.00 M USD, and current EBITDA margin is −18.98%. See more stats in Vroom, Inc. financial statements.