TWOU (2U bounce or kill learning )Ladies and gentlemen, esteemed educators, and future leaders,
As we stand on the cusp of a new era, the winds of change whisper promises of transformation and progress. In this age of relentless innovation, where the boundaries of possibility are constantly pushed, we find ourselves at the forefron
−3.9360USD
−317.61 MUSD
945.95 MUSD
76.64 M
About 2U, Inc.
Sector
Industry
CEO
Paul S. Lalljie
Website
Headquarters
Lanham
Employees (FY)
5.57 K
Founded
2008
ISIN
US90214J1016
FIGI
BBG001KS9450
2U, Inc. engages in the provision of education technology for nonprofit colleges and universities. It operates through the following segments: Degree Program and Alternative Credential. The Degree Program segment provides technology and services to nonprofit colleges and universities to enable the online delivery of degree programs. The Alternative Credential segment provides premium online short courses and technical, skills-based boot camps through relationships with nonprofit colleges and universities. The company was founded by Christopher J. Paucek in April 2008 and is headquartered in Lanham, MD.

2U (Is e-education the future?) I stand before you to discuss the transformative power of e-education and its pivotal role in shaping the future of learning. As we navigate the dynamic landscape of education, e-learning emerges as a beacon of innovation, offering unprecedented opportunities for learners across the globe.
In this

TWOU Long PositionHi traders.
TWOU looks interesting.
Let´s wait for the breakout and after the price retest the resistance line and confirmed as the support, enter the long position.
Three targets are indicated on the chart.
Good luck!

TWOU Needs to Leverage AITWOU was bashed down heavily by the idea that AI would negate the need for education.
However, I surmise that the opposite could be true, and that we all might need to learn how to correctly use AI.
AI only works to a % depending on the DATA inputted to Scan a Vast knowledge base, some of which is D

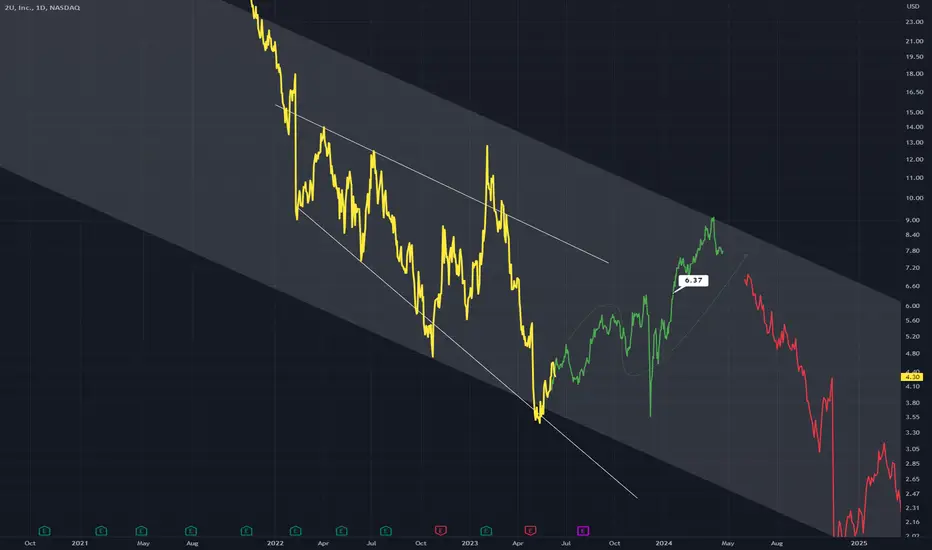
TWOU - Might See Relief Within Down ChannelA large broadening wedge has formed on chart
I expect a short term recovery within the wedge and then rejection back into the channel as shown with the bars pattern tool.
Daily timeframe.
$TWOU - Looking For A DoubleLooking for this to retest $14 in the next couple months.
Layoffs (20%) and new corporate focus should help this for Q3 & Q4 reporting - should see better EPS.
GLTA
- C

Long Calls TWOUFew things bullish here
1. Lower timeframe Regression starting the turn, and higher should follow
2. Inside day and may try for an inside week
3. Gap above that may try to fill
Play- Buying Oct 12 strike calls, looking for the 14 area as a target area

TWOU - gapfillMight possibly have a bounce to fill the gap.
__________________________________________
2U, Inc. engages in the provision of education technology for nonprofit colleges and universities. It operates through the following segments: Degree Program and Alternative Credential. The Degree Program segme

TWOU Swing tradeHey all, $TWOU is in a strong downtrend for a long time, and we can expect a nice bounce from the CMP.
Buy targets: $12, $16, $21, $24, $32
Not financial advice. Do your own research

"TWOU" "2U"A player who make a difference in the Edu market.
Educational Services industry is $1.4tr in 2021.
What do you think will happen by 2025? 2030?
Exactly!!

See all ideas
Trade directly on the supercharts through our supported, fully-verified and user-reviewed brokers.


Curated watchlists where TWOU is featured.


Frequently Asked Questions
The current price of TWOU is 0.2700 USD — it has decreased by 3.95% in the past 24 hours.
Depending on the exchange, the stock ticker may vary. For instance, on NASDAQ exchange 2U, Inc. stocks are traded under the ticker TWOU.
2U, Inc. is going to release the next earnings report on May 2, 2024. Keep track of upcoming events with our Earnings Calendar.
TWOU stock is 10.70% volatile and has beta coefficient of 3.73. Check out the list of the most volatile stocks — is 2U, Inc. there?
One year price forecast for 2U, Inc. has a max estimate of 1.5000 USD and a min estimate of 1.0000 USD.
TWOU earnings for the last quarter are −0.15 USD whereas the estimation was −0.13 USD which accounts for −13.22% surprise. Estimated earnings for the next quarter are 0.64 USD. See more details about 2U, Inc. earnings.
2U, Inc. revenue for the last quarter amounts to 229.70 M USD despite the estimated figure of 224.04 M USD. In the next quarter revenue is expected to reach 277.29 M USD.
Yes, you can track 2U, Inc. financials in yearly and quarterly reports right on TradingView.
TWOU stock has fallen by 23.94% compared to the previous week, the month change is a 16.67% fall, over the last year 2U, Inc. has showed a 94.49% decrease.
TWOU net income for the last quarter is −42.45 M USD, while the quarter before that showed −47.44 M USD of net income which accounts for 10.53% change. Track more 2U, Inc. financial stats to get the full picture.
Today 2U, Inc. has the market capitalization of 23.51 M, it has decreased by 7.77% over the last week.
No, TWOU doesn't pay any dividends to its shareholders. But don't worry, we've prepared a list of high-dividend stocks for you.
Like other stocks, TWOU shares are traded on stock exchanges, e.g. Nasdaq, Nyse, Euronext, and the easiest way to buy them is through an online stock broker. To do this, you need to open an account and follow a broker's procedures, then start trading. You can trade 2U, Inc. stock right from TradingView charts — choose your broker and connect to your account.
As of Apr 18, 2024, the company has 5.57 K employees. See our rating of the largest employees — is 2U, Inc. on this list?
Investing in stocks requires a comprehensive research: you should carefully study all the available data, e.g. company's financials, related news, and its technical analysis. So 2U, Inc. technincal analysis shows the sell today, and its 1 week rating is sell. Since market conditions are prone to changes, it's worth looking a bit further into the future — according to the 1 month rating 2U, Inc. stock shows the sell signal. See more of 2U, Inc. technicals for a more comprehensive analysis.
If you're still not sure, try looking for inspiration in our curated watchlists.
If you're still not sure, try looking for inspiration in our curated watchlists.
We've gathered analysts' opinions on 2U, Inc. future price: according to them, TWOU price has a max estimate of 1.50 USD and a min estimate of 1.00 USD. Read a more detailed 2U, Inc. forecast: see what analysts think of 2U, Inc. and suggest that you do with its stocks.
EBITDA measures a company's operating performance, its growth signifies an improvement in the efficiency of a company. 2U, Inc. EBITDA is 131.45 M USD, and current EBITDA margin is 13.35%. See more stats in 2U, Inc. financial statements.