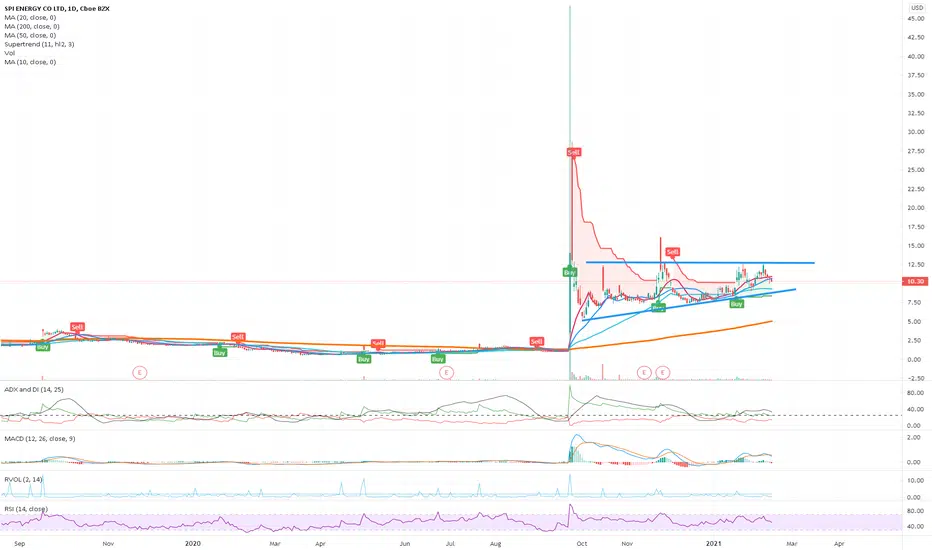
SPI: Sell ideaOn SPI we have a sell idea as you see on the chart because we have the breakout of vwap and support line.Thanks!
−0.8079USD
−33.42 MUSD
177.52 MUSD
23.22 M
About SPI Energy Co., Ltd.
Sector
Industry
CEO
Xiao Feng Peng
Website
Headquarters
Sacramento
Employees (FY)
316
Founded
2006
ISIN
KYG8651P1101
FIGI
BBG00BSDYRR0
SPI Energy Co. Ltd. is a global renewable energy company, which engages in the provision of solar storage and electric vehicle solutions. It operates through the following segments: Renewable Energy Solutions, Solar Projects Development, Electric Vehicles, and Others. The company was founded in 2006 and is headquartered in Sacramento, CA.

SPI | A Risky Oversold Company | BounceSPI Energy Co., Ltd. provides photovoltaic and electric vehicle (EV) solutions for business, residential, government, and utility customers and investors in Australia, Japan, Italy, the United States, the United Kingdom, and Greece. The company offers engineering, procurement, and construction servi

SPI run up within coming week?I am looking to take a trade on this one on Monday morning if the volume and activity of the day looks promising pre-market. Looking to make an entry at $4 and will scale back positions as it goes.
I see some heavy resistance around the 4.39 zone but believe we can see a good climb up from there i


SPISpi Energy Co Ltd (NASDAQ:SPI) The EV sector is too HOT to ignore this small EV maker. The company reported solid numbers last week, the revenue increased to $79.4 million, up 41% over the $56.4 million generated in the first half of 2020 and the gross profit increased to $7.4 million, up 134% over

SPI Energy Co Ltd (SPI)It’s never too soon to start thinking about your financial future. We work with our clients to help them better understand what options are available, and advise them on the best investment decisions to make. Together we’ll set, achieve, and exceed all of your financial goals.


SPIReally weird gap up today given its complete drain over the past few days from the last gap up. Not really sure what to think here, I’d like to call this a breakout but not a fan of when stocks gap through the breakout area. That being said, if it does hold, I could see this having enough shorts tra

SPI long PI Energy Co., Ltd. provides photovoltaic solutions for business, residential, government, and utility customers and investors. It offers engineering, procurement, and construction services to independent power developers and producers, and commercial and industrial companies. The company also deve

See all ideas
Trade directly on the supercharts through our supported, fully-verified and user-reviewed brokers.


Frequently Asked Questions
The current price of SPI is 0.49 USD — it has decreased by 1.44% in the past 24 hours.
Depending on the exchange, the stock ticker may vary. For instance, on NASDAQ exchange SPI Energy Co., Ltd. stocks are traded under the ticker SPI.
SPI Energy Co., Ltd. is going to release the next earnings report on May 13, 2024. Keep track of upcoming events with our Earnings Calendar.
One year price forecast for SPI Energy Co., Ltd. has a max estimate of 1.25 USD and a min estimate of 1.25 USD.
SPI Energy Co., Ltd. revenue for the last quarter amounts to 55.90 M USD despite the estimated figure of 55.90 M USD. In the next quarter revenue is expected to reach 50.20 M USD.
Yes, you can track SPI Energy Co., Ltd. financials in yearly and quarterly reports right on TradingView.
SPI stock has fallen by 20.26% compared to the previous week, the month change is a 18.81% fall, over the last year SPI Energy Co., Ltd. has showed a 61.20% decrease.
Like other stocks, SPI shares are traded on stock exchanges, e.g. Nasdaq, Nyse, Euronext, and the easiest way to buy them is through an online stock broker. To do this, you need to open an account and follow a broker's procedures, then start trading. You can trade SPI Energy Co., Ltd. stock right from TradingView charts — choose your broker and connect to your account.
As of Apr 18, 2024, the company has 316.00 employees. See our rating of the largest employees — is SPI Energy Co., Ltd. on this list?