RUSH.A and RUSH.B - Acquisitions in the works.Quick technical analysis on Rush Enterprises. This is a consumer cyclical trucking dealership. They are very dominant in this market space and currently in the process of acquiring 30 more locations. This is a good long-term portfolio addition. Because of the acquisitions coming in play, this could
4.27USD
347.06 MUSD
7.93 BUSD
8.05 M
About Rush Enterprises, Inc.
Sector
Industry
CEO
William M. Rush
Website
Headquarters
New Braunfels
Employees (FY)
8.51 K
Founded
1965
FIGI
BBG000PLMQP6
Rush Enterprises, Inc. engages in the business of retailing commercial vehicles. It operates under the Truck and All Other segments. The Truck segment includes an operating network of commercial vehicle dealerships that provide an integrated one-stop source for the commercial vehicle needs of its customers, including retail sales of new and used commercial vehicles, aftermarket parts, service, and collision center facilities, and financial services, including the financing of new and used commercial vehicle purchases, insurance products, and truck leasing and rentals. The All Other segment focuses on the retail tire company, an insurance agency, and a guest ranch operation. The company was founded by W. Marvin Rush in 1965 and is headquartered in New Braunfels, TX.

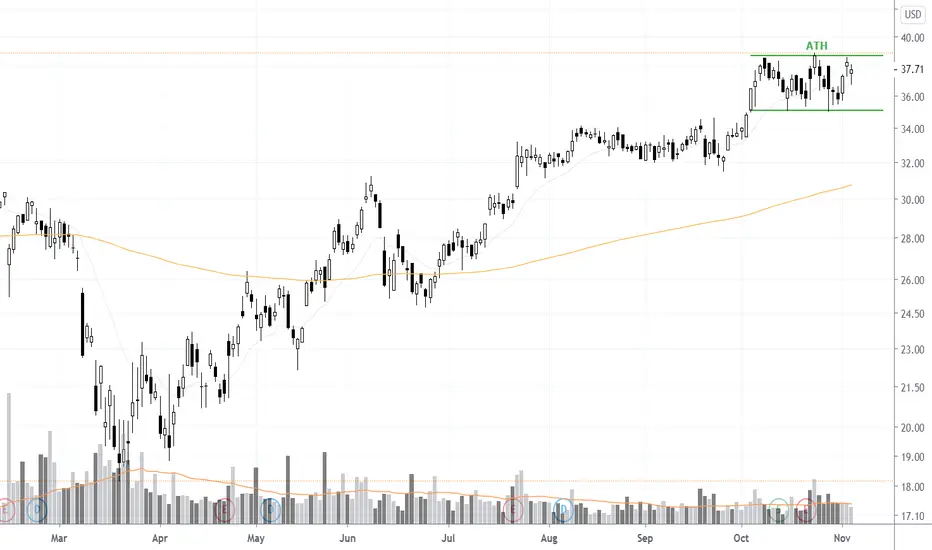
$RUSHA 1 Month #Rectangle @ ATHsNASDAQ:RUSHA is consolidating at ATHs forming a 1 month rectangle chart pattern. The $38.65 level been acting as resistance. A daily close about that level should propel the stock into higher prices and trigger a long swing trade entry.
RUSHA EarningsIf trucking (KNX) is hitting record revenue, and UPS is setting record revenues, and truck manufacturers (PCAR) are setting record revenues, then it only goes to follow that truck dealerships should be doing fairly well in revenue....
Rush sells Peterbilt, International, Hino, Ford, Isuzu, Mitsubi

Rusha looks good (1)Rusha went down with the market, it dropped 31% and since has been consolidating. Recently it tested the 38 dollar price level and it showed strength. my strategy is two wait 1,5 month for extra consolidation then get ready to buy potential breakout. Second scenario is an ABCD pattern to the downsid

See all ideas
Trade directly on the supercharts through our supported, fully-verified and user-reviewed brokers.


Frequently Asked Questions
The current price of RUSHB is 46.00 USD — it has decreased by 1.12% in the past 24 hours.
Depending on the exchange, the stock ticker may vary. For instance, on NASDAQ exchange Rush Enterprises, Inc. stocks are traded under the ticker RUSHB.
Rush Enterprises, Inc. is going to release the next earnings report on Apr 23, 2024. Keep track of upcoming events with our Earnings Calendar.
RUSHB stock is 2.77% volatile and has beta coefficient of 1.30. Check out the list of the most volatile stocks — is Rush Enterprises, Inc. there?
One year price forecast for Rush Enterprises, Inc. has a max estimate of 60.00 USD and a min estimate of 57.00 USD.
RUSHB earnings for the last quarter are 0.96 USD per share, whereas the estimation was 0.91 USD resulting in a 6.08% surprise. The estimated earnings for the next quarter are 0.85 USD per share. See more details about Rush Enterprises, Inc. earnings.
Rush Enterprises, Inc. revenue for the last quarter amounts to 1.98 B USD despite the estimated figure of 1.96 B USD. In the next quarter revenue is expected to reach 1.88 B USD.
Yes, you can track Rush Enterprises, Inc. financials in yearly and quarterly reports right on TradingView.
RUSHB stock has fallen by 5.52% compared to the previous week, the month change is a 12.94% fall, over the last year Rush Enterprises, Inc. has showed a 14.54% increase.
RUSHB net income for the last quarter is 78.05 M USD, while the quarter before that showed 80.28 M USD of net income which accounts for −2.78% change. Track more Rush Enterprises, Inc. financial stats to get the full picture.
Today Rush Enterprises, Inc. has the market capitalization of 3.61 B, it has decreased by 1.00% over the last week.
Yes, RUSHB dividends are paid quarterly. The last dividend per share was 0.17 USD. As of today, Dividend Yield (TTM)% is 1.41%. Tracking Rush Enterprises, Inc. dividends might help you take more informed decisions.
Rush Enterprises, Inc. dividend yield was 1.17% in 2023, and payout ratio reached 14.96%. The year before the numbers were 1.42% and 11.68% correspondingly. See high-dividend stocks and find more opportunities for your portfolio.
Like other stocks, RUSHB shares are traded on stock exchanges, e.g. Nasdaq, Nyse, Euronext, and the easiest way to buy them is through an online stock broker. To do this, you need to open an account and follow a broker's procedures, then start trading. You can trade Rush Enterprises, Inc. stock right from TradingView charts — choose your broker and connect to your account.
As of Apr 23, 2024, the company has 8.51 K employees. See our rating of the largest employees — is Rush Enterprises, Inc. on this list?
Investing in stocks requires a comprehensive research: you should carefully study all the available data, e.g. company's financials, related news, and its technical analysis. So Rush Enterprises, Inc. technincal analysis shows the sell today, and its 1 week rating is sell. Since market conditions are prone to changes, it's worth looking a bit further into the future — according to the 1 month rating Rush Enterprises, Inc. stock shows the buy signal. See more of Rush Enterprises, Inc. technicals for a more comprehensive analysis.
If you're still not sure, try looking for inspiration in our curated watchlists.
If you're still not sure, try looking for inspiration in our curated watchlists.
We've gathered analysts' opinions on Rush Enterprises, Inc. future price: according to them, RUSHB price has a max estimate of 60.00 USD and a min estimate of 57.00 USD. Read a more detailed Rush Enterprises, Inc. forecast: see what analysts think of Rush Enterprises, Inc. and suggest that you do with its stocks.
EBITDA measures a company's operating performance, its growth signifies an improvement in the efficiency of a company. Rush Enterprises, Inc. EBITDA is 732.68 M USD, and current EBITDA margin is 9.25%. See more stats in Rush Enterprises, Inc. financial statements.