MESA | Great Long Entry | AirlinesMesa Air Group, Inc. operates as the holding company for Mesa Airlines, Inc. that provides regional air carrier services under capacity purchase agreements with the American Airlines and the United Airlines. It also engages in leasing aircrafts to third parties. As of September 30, 2021, the company
−2.9916USD
−120.12 MUSD
498.07 MUSD
32.04 M
About Mesa Air Group, Inc.
Sector
Industry
CEO
Jonathan G. Ornstein
Website
Headquarters
Phoenix
Employees (FY)
2.3 K
Founded
1982
ISIN
US5904791358
FIGI
BBG00LFWMKM3
Mesa Air Group, Inc. is a holding company, which engages in the provision of regional air carrier and passenger transportation services. Its fleet include American Eagle, United Express, and DHL Express flights. The company was founded in 1982 and is headquartered in Phoenix, AZ.

JETS america holdingsJets american holdings -ATSG
1. mesa
2.AAL
3. ALK
4. ALGT
5. SKYW
6. UAL
7. AC
8. JBLU
9. LUV
10. DAL
11. GD

MESA - The Ladder *ON LONG WATCH*This one is going to have some fighting to due up to $4.. Once we can get it past 3.90/4 it should take off big time.
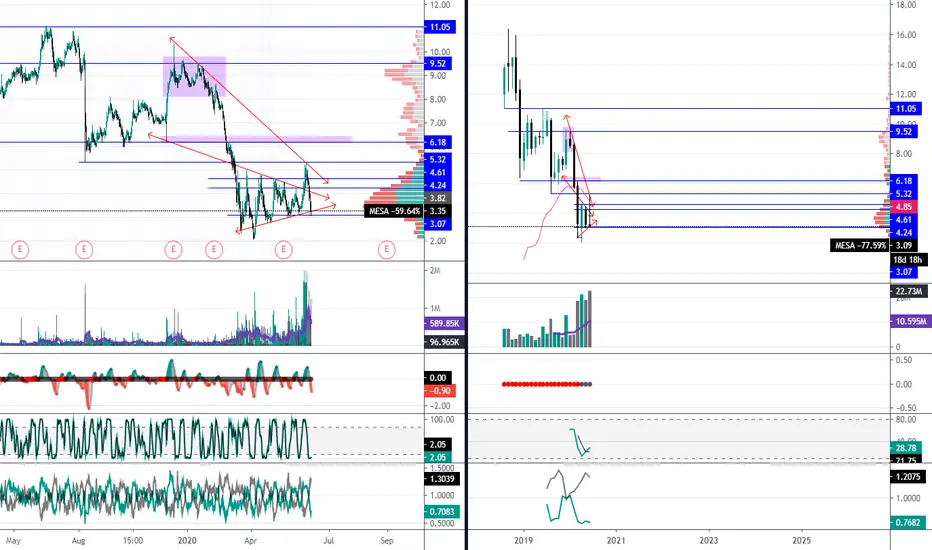
MESA Airline stocks endured a miserable 2020 due to the pandemic, but Mesa is not a typical airline. The company operates small planes under contracts with larger partners. In Mesa's case, that means it flies primarily for American Airlines Group (NASDAQ: AAL), United Airlines Holdings (NASDAQ: UAL), and

US Stock In Play: $MESA (Mesa Air Group Inc)$MESA traded with a substantial day gain of +9.01%, closing at a 52 weeks high of $14.16 this morning. Share price of $MESA have doubled from $6.80 within a short span of four trading weeks, upon breaking out of a Symmetrical Triangle chart pattern with flattening volume and implied volatility over
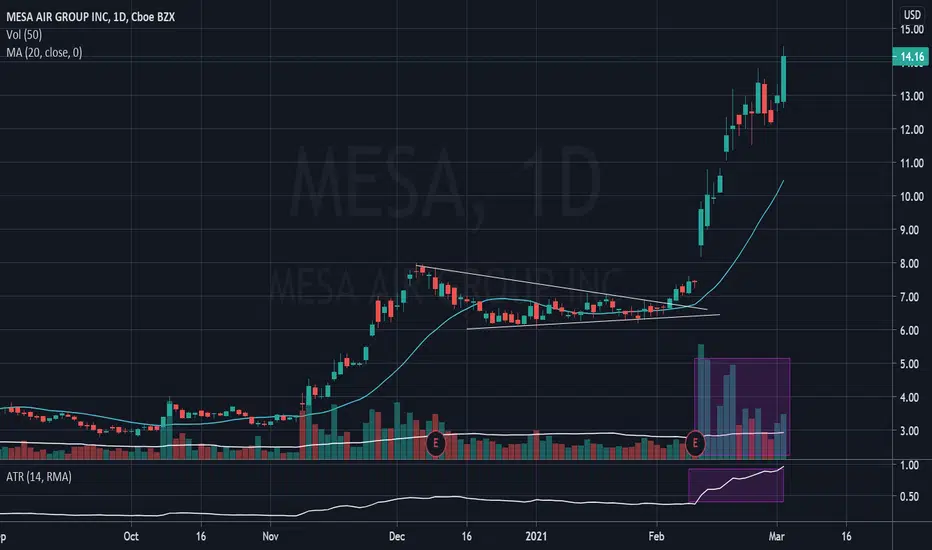


Mesa AirIncredible 300% increase over just a range of about 100 days. Earnings have been over expectation for the last two quarters and there is a dramatic increase in volume over the last week. The options market has started to increase as well with 10,000 Open interest for the $12 Call with the 19 Mar 21

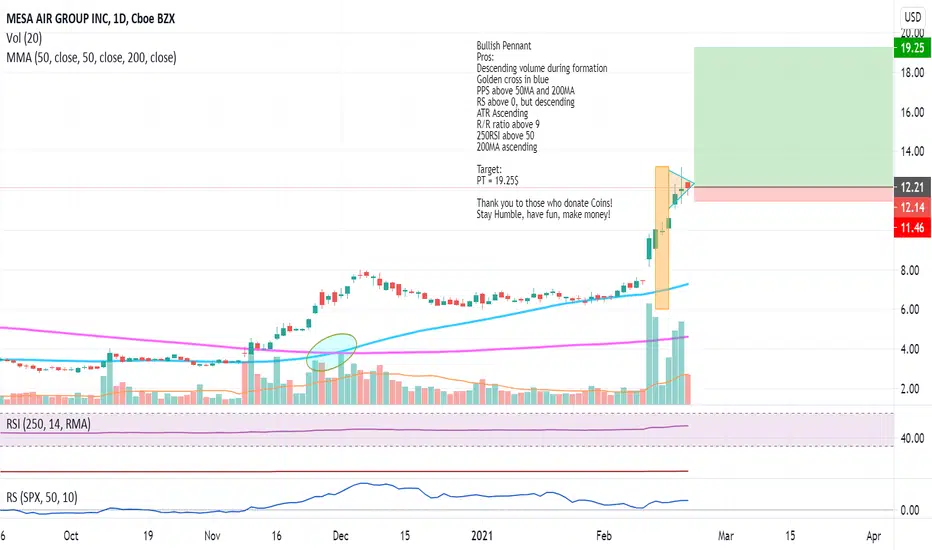
MESA: Bullish PennantBullish Pennant
Pros:
Descending volume during formation
Golden cross in blue
PPS above 50MA and 200MA
RS above 0, but descending
ATR Ascending
R/R ratio above 9
250RSI above 50
200MA ascending
Target:
PT = 19.25$
Thank you to those who donate Coins!
Stay Humble, have fun, make money!
$MESABroke out of falling wedge/bull flag to the upside & re-tested the break out
Daily and 4hr hidden bullish divergence
on the MACD and RSI
Stop is below lowest candle low of the retracement
1st, 2nd & 3rd Targets are all at each resistance level

See all ideas
Trade directly on the supercharts through our supported, fully-verified and user-reviewed brokers.


Frequently Asked Questions
The current price of MESA is 0.8451 USD — it has decreased by 1.73% in the past 24 hours.
Depending on the exchange, the stock ticker may vary. For instance, on NASDAQ exchange Mesa Air Group, Inc. stocks are traded under the ticker MESA.
Mesa Air Group, Inc. is going to release the next earnings report on May 6, 2024. Keep track of upcoming events with our Earnings Calendar.
MESA stock is 4.81% volatile and has beta coefficient of 4.17. Check out the list of the most volatile stocks — is Mesa Air Group, Inc. there?
One year price forecast for Mesa Air Group, Inc. has a max estimate of 2.0000 USD and a min estimate of 2.0000 USD.
MESA earnings for the last quarter are −0.64 USD per share, whereas the estimation was −0.15 USD resulting in a −326.67% surprise. The estimated earnings for the next quarter are −0.09 USD per share. See more details about Mesa Air Group, Inc. earnings.
Mesa Air Group, Inc. revenue for the last quarter amounts to 114.37 M USD despite the estimated figure of 114.00 M USD. In the next quarter revenue is expected to reach 126.00 M USD.
Yes, you can track Mesa Air Group, Inc. financials in yearly and quarterly reports right on TradingView.
MESA stock has risen by 5.60% compared to the previous week, the month change is a 4.33% rise, over the last year Mesa Air Group, Inc. has showed a 61.93% decrease.
MESA net income for the last quarter is −28.34 M USD, while the quarter before that showed −47.56 M USD of net income which accounts for 40.40% change. Track more Mesa Air Group, Inc. financial stats to get the full picture.
Today Mesa Air Group, Inc. has the market capitalization of 35.21 M, it has increased by 7.05% over the last week.
No, MESA doesn't pay any dividends to its shareholders. But don't worry, we've prepared a list of high-dividend stocks for you.
Like other stocks, MESA shares are traded on stock exchanges, e.g. Nasdaq, Nyse, Euronext, and the easiest way to buy them is through an online stock broker. To do this, you need to open an account and follow a broker's procedures, then start trading. You can trade Mesa Air Group, Inc. stock right from TradingView charts — choose your broker and connect to your account.
As of Apr 19, 2024, the company has 2.30 K employees. See our rating of the largest employees — is Mesa Air Group, Inc. on this list?
Investing in stocks requires a comprehensive research: you should carefully study all the available data, e.g. company's financials, related news, and its technical analysis. So Mesa Air Group, Inc. technincal analysis shows the neutral today, and its 1 week rating is sell. Since market conditions are prone to changes, it's worth looking a bit further into the future — according to the 1 month rating Mesa Air Group, Inc. stock shows the sell signal. See more of Mesa Air Group, Inc. technicals for a more comprehensive analysis.
If you're still not sure, try looking for inspiration in our curated watchlists.
If you're still not sure, try looking for inspiration in our curated watchlists.
We've gathered analysts' opinions on Mesa Air Group, Inc. future price: according to them, MESA price has a max estimate of 2.00 USD and a min estimate of 2.00 USD. Read a more detailed Mesa Air Group, Inc. forecast: see what analysts think of Mesa Air Group, Inc. and suggest that you do with its stocks.
EBITDA measures a company's operating performance, its growth signifies an improvement in the efficiency of a company. Mesa Air Group, Inc. EBITDA is 23.19 M USD, and current EBITDA margin is 4.66%. See more stats in Mesa Air Group, Inc. financial statements.