−1.6496USD
−7.95 MUSD
4.14 MUSD
3.28 M
About InMed Pharmaceuticals Inc.
Sector
CEO
Eric A. Adams
Headquarters
Vancouver
Website
Employees (FY)
13
Founded
1981
ISIN
CA4576376012
FIGI
BBG000BT4589
InMed Pharmaceuticals, Inc. engages in the provision of biopharmaceutical research. It is also involved in cannabinoid-based therapies and a biosynthesis system for the manufacturing of pharmaceutical-grade cannabinoids. It operates through the InMed and BayMedica segments. The company was founded by Christopher Bogart, Sazzad Hossain, Hyder A. Khoja, and Craig D. Schneider on May 19, 1981 and is headquartered in Vancouver, Canada.


INM | This is a Runner | LONGInMed Pharmaceuticals Inc., a clinical stage pharmaceutical company, develops a pipeline of prescription-based products. The company operates through two segments, the InMed and the BayMedica. The InMed segment researches and develops cannabinoid-based pharmaceuticals products. The BayMedica segment

Looks like a great buying opportunity Looks like a great buying opportunity, the stock looks highly oversold, with a short term spike in volatility, this could be a good candidates for a mind to long term bull run and considering the new report on the benefits of cannabinoids.

Huge Gap on InMed. INMInMed Pharmaceuticals produced an absolutely monster gap that now needs to be worked backwards in these very bearish circumstances. Fibs give some initial goals. Negative momentum loop done. The pull out will on a divergence or completion of Fibgoals, whichever occurs first.

InMed needs medicine. INMGoals 0.56, 0.49. Invalidation at 0.89.
We are not in the business of getting every prediction right, no one ever does and that is not the aim of the game. The Fibonacci targets are highlighted in purple with invalidation in red. Fibonacci goals, it is prudent to suggest, are nothing more than mere

INM 1W Swing editiontest
InMed Pharmaceuticals, Inc. engages in the provision of biopharmaceutical research and development of novel. It also involves in cannabinoid-based therapies and a biosynthesis system for the manufacturing of pharmaceutical-grade cannabinoids. The company was founded by Christopher Bogart, Sazza
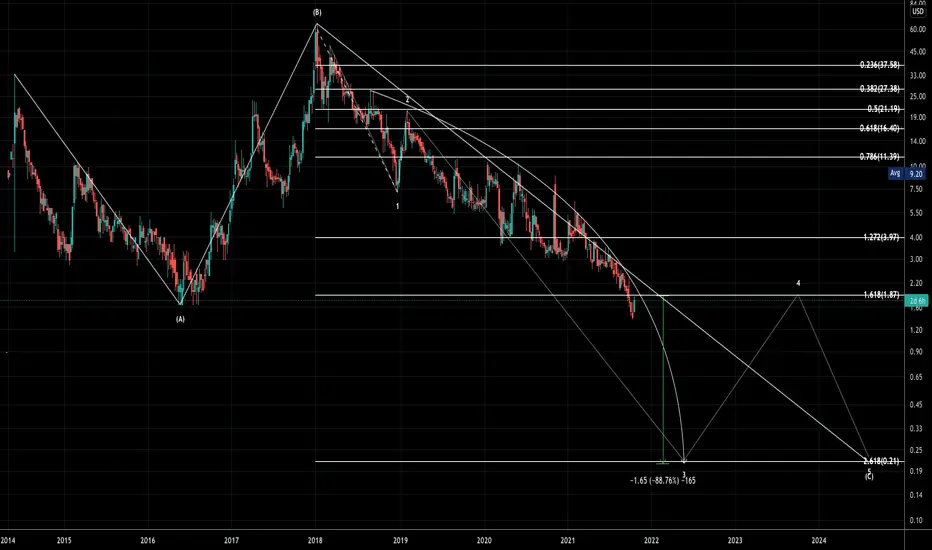
INM $7.5 target short termFirst has to maintain the .236 fib at $4.71 for me to consider an entry, getting to $7.5+ shouldn't be a problem after that.

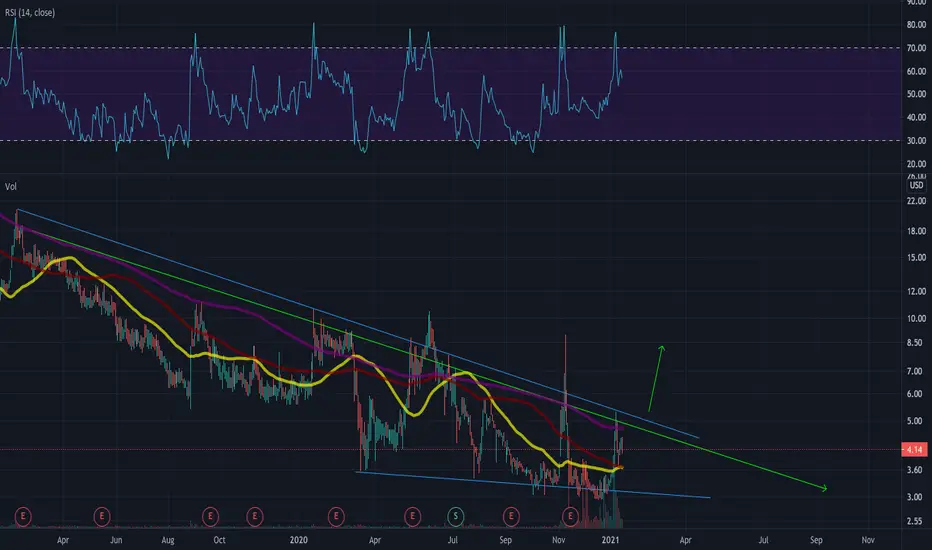
big breakout if resistance breaks. be patient hererecently rejected at resistance, but if it breaks we know what will happen... a test of 7 and 50 percent run that day! just like pola did with it broke top trendline resistance friday! we just missed that one :( next time! good luck longs ! have a great marthin luther king jr day tomorrow <3
See all ideas
Trade directly on the supercharts through our supported, fully-verified and user-reviewed brokers.


Frequently Asked Questions
The current price of INM is 0.31 USD — it has decreased by 4.16% in the past 24 hours.
Depending on the exchange, the stock ticker may vary. For instance, on NASDAQ exchange InMed Pharmaceuticals Inc. stocks are traded under the ticker INM.
InMed Pharmaceuticals Inc. is going to release the next earnings report on May 9, 2024. Keep track of upcoming events with our Earnings Calendar.
INM earnings for the last quarter are −0.91 USD whereas the estimation was −4.50 USD which accounts for 79.78% surprise. Estimated earnings for the next quarter are −4.50 USD. See more details about InMed Pharmaceuticals Inc. earnings.
InMed Pharmaceuticals Inc. revenue for the last quarter amounts to 901.86 K USD despite the estimated figure of 1.39 M USD. In the next quarter revenue is expected to reach 1.13 M USD.
Yes, you can track InMed Pharmaceuticals Inc. financials in yearly and quarterly reports right on TradingView.
Like other stocks, INM shares are traded on stock exchanges, e.g. Nasdaq, Nyse, Euronext, and the easiest way to buy them is through an online stock broker. To do this, you need to open an account and follow a broker's procedures, then start trading. You can trade InMed Pharmaceuticals Inc. stock right from TradingView charts — choose your broker and connect to your account.
As of Apr 16, 2024, the company has 13.00 employees. See our rating of the largest employees — is InMed Pharmaceuticals Inc. on this list?
EBITDA measures a company's operating performance, its growth signifies an improvement in the efficiency of a company. InMed Pharmaceuticals Inc. EBITDA is −6.40 M USD, and current EBITDA margin is −188.78%. See more stats in InMed Pharmaceuticals Inc. financial statements.