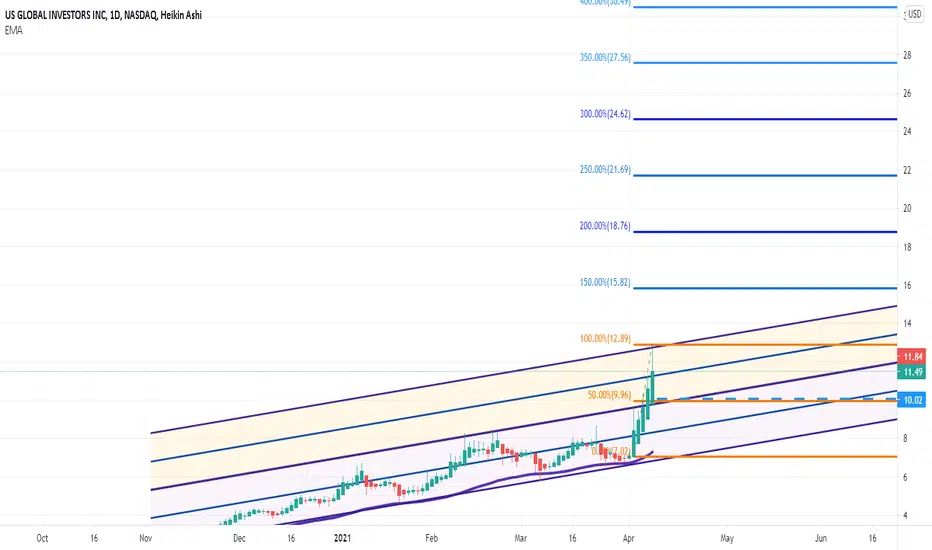
Nice Move ExpectedChart speaks for itself but it is also backed by the fact that GROW is ~40% held by institutions.
0.22USD
3.15 MUSD
16.29 MUSD
11.42 M
About U.S. Global Investors, Inc.
Sector
Industry
CEO
Frank Edward Holmes
Website
Headquarters
San Antonio
Employees (FY)
21
Founded
1968
ISIN
US9029521005
FIGI
BBG000BBVVP2
U.S. Global Investors, Inc. engages in the provision of investment advisory services. It operates through the Investment Management Services and Corporate Investments segments. The Investment Management Services segment offers a range of investment management products and services to offshore and exchange traded fund clients. The Corporate Investments segment invests in its own accounts to add growth and value to its cash position. The company was founded in 1968 and is headquartered in San Antonio, TX.

GROWGROW asset managers 100mil market cap they own and created JETS etf also own HIVE (crypto mining)...reopening/crypto play........its more about ppl getting excited about reopening then the actually success of reopening....since they run the ETF weather the ETF goes up or down as long as the its AUM

U.S. Global Investors, Inc. Short term Trade U.S. Global Investors, Inc. engages in the provision of investment advisory services. It operates through the following segments: Investment Management Services, Investment Management Services-Canada, and Corporate Investments. The Investment Management Services segment offers a range of investment


Historically entangled - $12, $15 and $24Given the current paradigm shift and spotlight on stores of value such as precious metals and crypto assets the symmetry ad entanglement on this chart is hard to deny. Big moves coming.


GROW - Bulling & Still GrowingU.S. Global Investors, Inc. engages in the provision of investment advisory services. It operates through the following segments: Investment Management Services, Investment Management Services-Canada, and Corporate Investments. The Investment Management Services segment offers a range of investment

Look who is ready for a comeback!Grow. I remember this is one of those I watched and became obsessed with trading. Crossed EMA50. RSI has clocked 50. Volume is above normal.


See all ideas
Trade directly on the supercharts through our supported, fully-verified and user-reviewed brokers.


Frequently Asked Questions
The current price of GROW is 2.74 USD — it has increased by 1.86% in the past 24 hours.
Depending on the exchange, the stock ticker may vary. For instance, on NASDAQ exchange U.S. Global Investors, Inc. stocks are traded under the ticker GROW.
U.S. Global Investors, Inc. is going to release the next earnings report on May 9, 2024. Keep track of upcoming events with our Earnings Calendar.
GROW stock is 3.33% volatile and has beta coefficient of 0.53. Check out the list of the most volatile stocks — is U.S. Global Investors, Inc. there?
Yes, you can track U.S. Global Investors, Inc. financials in yearly and quarterly reports right on TradingView.
GROW stock has fallen by 2.14% compared to the previous week, the month change is a 3.59% rise, over the last year U.S. Global Investors, Inc. has showed a 1.08% decrease.
GROW net income for the last quarter is 1.23 M USD, while the quarter before that showed −176.00 K USD of net income which accounts for 798.30% change. Track more U.S. Global Investors, Inc. financial stats to get the full picture.
Today U.S. Global Investors, Inc. has the market capitalization of 38.71 M, it has decreased by 2.39% over the last week.
Yes, GROW dividends are paid monthly. The last dividend per share was 0.01 USD. As of today, Dividend Yield (TTM)% is 3.28%. Tracking U.S. Global Investors, Inc. dividends might help you take more informed decisions.
U.S. Global Investors, Inc. dividend yield was 2.94% in 2023, and payout ratio reached 41.84%. The year before the numbers were 2.04% and 39.27% correspondingly. See high-dividend stocks and find more opportunities for your portfolio.
Like other stocks, GROW shares are traded on stock exchanges, e.g. Nasdaq, Nyse, Euronext, and the easiest way to buy them is through an online stock broker. To do this, you need to open an account and follow a broker's procedures, then start trading. You can trade U.S. Global Investors, Inc. stock right from TradingView charts — choose your broker and connect to your account.
As of Apr 19, 2024, the company has 21.00 employees. See our rating of the largest employees — is U.S. Global Investors, Inc. on this list?
Investing in stocks requires a comprehensive research: you should carefully study all the available data, e.g. company's financials, related news, and its technical analysis. So U.S. Global Investors, Inc. technincal analysis shows the sell today, and its 1 week rating is sell. Since market conditions are prone to changes, it's worth looking a bit further into the future — according to the 1 month rating U.S. Global Investors, Inc. stock shows the sell signal. See more of U.S. Global Investors, Inc. technicals for a more comprehensive analysis.
If you're still not sure, try looking for inspiration in our curated watchlists.
If you're still not sure, try looking for inspiration in our curated watchlists.
EBITDA measures a company's operating performance, its growth signifies an improvement in the efficiency of a company. U.S. Global Investors, Inc. EBITDA is 2.09 M USD, and current EBITDA margin is 15.51%. See more stats in U.S. Global Investors, Inc. financial statements.