FTFT New Blockchain Division | digital currency trading serviceThe blockchain division purpose is to develop, operate and manage the Company's previously announced bitcoin mining farm in the United States and Paraguay and to coordinate its announced Dubai-based digital currency trading service and crypto asset management.
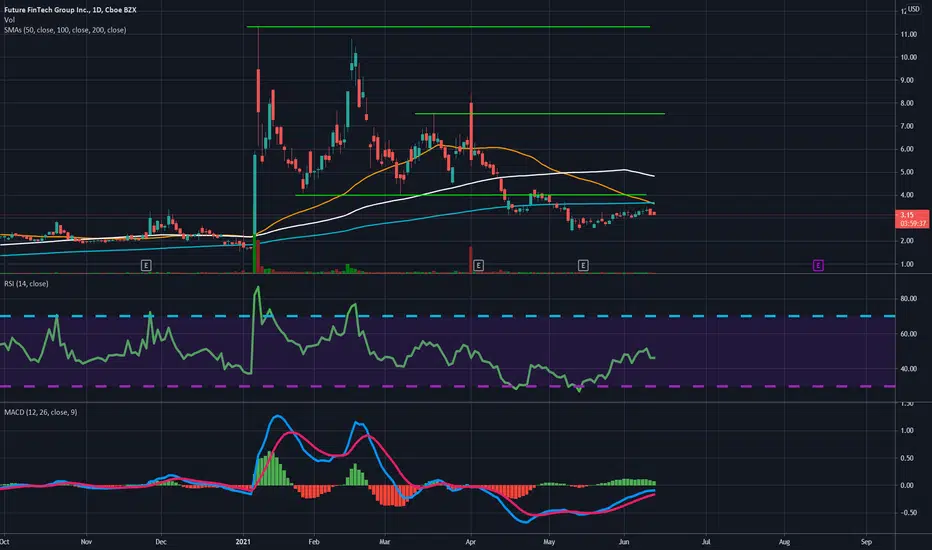
My price target is the 3.15 resistanc
−2.2857USD
−13.63 MUSD
23.88 MUSD
10.34 M
About Future FinTech Group Inc.
Sector
Industry
CEO
Shan Chun Huang
Website
Headquarters
New York
Employees (FY)
80
Founded
1998
ISIN
US36117V2043
FIGI
BBG000F57BQ1
Future FinTech Group, Inc. is a holding company, which engages in the operation of a real name blockchain based e-commerce platform. Its activities include a blockchain-based online shopping mall platform, Chain Cloud Mall (CCM), a cross-border e-commerce platform (NONOGIRL), an incubator for blockchain based application projects, and a digital payment system (DCON). It operates through the following segments: CCM Shopping Mall Membership, Coals and Aluminum Ingots Supply Chain Financing/Trading, Asset Management Service, and Others. The company was founded on June 29, 1998 and is headquartered in New York, NY.

$FTFT is gonna fall todayPupm&Dump trading strategy idea.
$FTFT is rising too much today.
The demand for shares of the company looks lower than the supply.
This and other conditions can cause a fall in the share price today.
So I opened a short position from $2,97;
stop-loss — $3,14;
take-profit — $2,62/MOC
Do not view


Closed my position. Decided today to take my losses on this as the daily chart is looking somewhat bearish. First the 50 sma line just went below the 200 sma line, which indicates a downtrend, and second the MACD looks to be closing green ready to turn red. This one is one that i got in based on hype and did not do my

FTFT - where to next?RSI is the lowest it has been in months. It should come back up.
Watch for rejection or breakout of RED trend line. If it bounces off we could encounter more downward pressure.
I would like to see it break above and close some 1H candles to confirm upward direction.

FTFT Blockchain can see a 1-2x from here easily if support holdsNot financial advice.
Everything detailed on chart.
2 different directions it can currently take but I'm leaning more it come to 4.50-5ish level then 2x from there.
But also can retest the 4.00 and 3.00 range as well.
Risk to reward seems greater to me as I see it can go higher than really lower aga

$FTFT Target PTs 11-20 and higherFuture FinTech Group Inc., through its subsidiaries, operates a real-name block chain e-commerce platform that integrates block chain and internet technology in People's Republic of China. It operates through CCM Shopping Mall Membership, Sales of Goods, and Others segments. The company offers Chain

FTFT at strong support levelBe cautious with FTFT - it is at a very strong support line. If it holds as before and breaks YELLOW resistance line, could PUMP very nice (as before).
Watch and wait for movement signal


See all ideas
Trade directly on the supercharts through our supported, fully-verified and user-reviewed brokers.


Frequently Asked Questions
The current price of FTFT is 0.8920 USD — it has increased by 1.36% in the past 24 hours.
Depending on the exchange, the stock ticker may vary. For instance, on NASDAQ exchange Future FinTech Group Inc. stocks are traded under the ticker FTFT.
Future FinTech Group Inc. is going to release the next earnings report on May 29, 2024. Keep track of upcoming events with our Earnings Calendar.
FTFT stock is 8.14% volatile and has beta coefficient of 0.36. Check out the list of the most volatile stocks — is Future FinTech Group Inc. there?
Yes, you can track Future FinTech Group Inc. financials in yearly and quarterly reports right on TradingView.
FTFT stock has fallen by 3.36% compared to the previous week, the month change is a 13.40% fall, over the last year Future FinTech Group Inc. has showed a 35.36% decrease.
FTFT net income for the last quarter is −27.88 M USD, while the quarter before that showed −2.41 M USD of net income which accounts for −1.06 K% change. Track more Future FinTech Group Inc. financial stats to get the full picture.
Today Future FinTech Group Inc. has the market capitalization of 13.15 M, it has decreased by 0.85% over the last week.
No, FTFT doesn't pay any dividends to its shareholders. But don't worry, we've prepared a list of high-dividend stocks for you.
Like other stocks, FTFT shares are traded on stock exchanges, e.g. Nasdaq, Nyse, Euronext, and the easiest way to buy them is through an online stock broker. To do this, you need to open an account and follow a broker's procedures, then start trading. You can trade Future FinTech Group Inc. stock right from TradingView charts — choose your broker and connect to your account.
As of Apr 19, 2024, the company has 80.00 employees. See our rating of the largest employees — is Future FinTech Group Inc. on this list?
Investing in stocks requires a comprehensive research: you should carefully study all the available data, e.g. company's financials, related news, and its technical analysis. So Future FinTech Group Inc. technincal analysis shows the sell today, and its 1 week rating is sell. Since market conditions are prone to changes, it's worth looking a bit further into the future — according to the 1 month rating Future FinTech Group Inc. stock shows the sell signal. See more of Future FinTech Group Inc. technicals for a more comprehensive analysis.
If you're still not sure, try looking for inspiration in our curated watchlists.
If you're still not sure, try looking for inspiration in our curated watchlists.
EBITDA measures a company's operating performance, its growth signifies an improvement in the efficiency of a company. Future FinTech Group Inc. EBITDA is −9.93 M USD, and current EBITDA margin is −28.48%. See more stats in Future FinTech Group Inc. financial statements.