NYSE - SwingTrading: Buy Signal BBSIThe stock BBSI (Barret Business Services) on our watchlist crossed a low risk enty point and generated a buy signal, we have opened a position and added BBSI to the JS-TechTrading portfolio.
SL is less than 5% (SL at 71.59), win target is > 10%.
BBSI has a high relative strentgh (IBD style) and bro
7.56USD
50.61 MUSD
1.07 BUSD
6.35 M
About Barrett Business Services, Inc.
Sector
Industry
CEO
Gary E. Kramer
Website
Headquarters
Vancouver
Employees (FY)
130.51 K
Founded
1951
ISIN
US0684631080
FIGI
BBG000BHJSC4
Barrett Business Services, Inc. engages in the provision of business management solutions for small and mid-sized companies. It develops a management platform that integrates a knowledge-based approach from the management consulting industry with tools from the human resource outsourcing industry. It focuses on professional employers, and staffing and recruiting services. The company was founded in 1951 and is headquartered in Vancouver, WA.

Barrett Business Services #BBSI long target 72$
Ticker BBSI Barrett Business Services, Inc. USA, Staffing & Employment Services
Market Cap 381.26M
EPS (ttm) 6.11
P/E 8.30 EPS this Y 26.00 % Forward P/E 9.86 EPS next Y 55.29 %
PEG 0.55 EPS past 5Y 30.30 % P/S 0.40 EPS next 5Y 15.00 % P/B 2.36 EPS Q/Q -45.90 %
Dividend 2.37% Sales

Breakout flagbbsi Looks pretty decent to me if this starts to move i will be looking to buy just above 84 with 88 target to possible $92

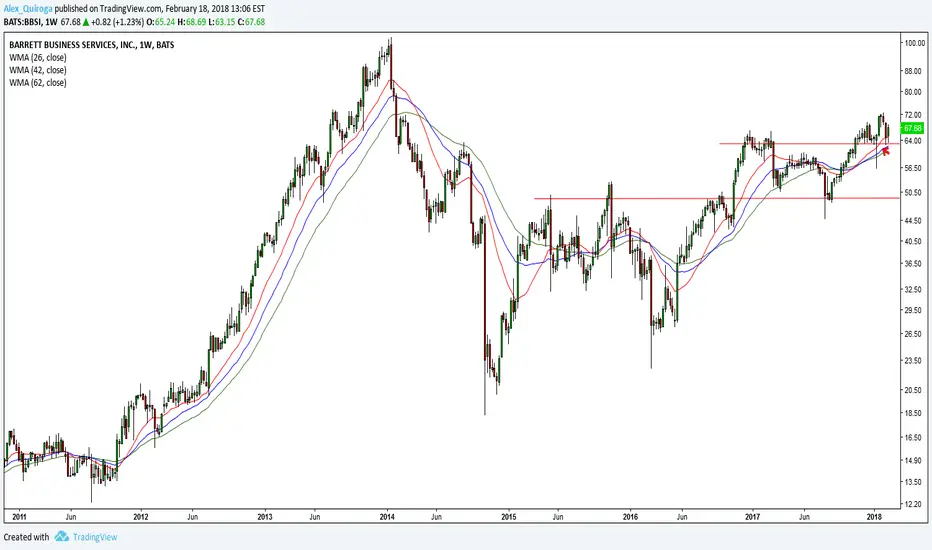
The prestige of weekly chartsResistance becomes Support has a major value when there is watching from a weekly view and has a rule:
One green candlestick closing above the resistance line and more weekly candles consolidating in the new level.
Even the weekly long lower shadow (look red arrow) has more weight looking from a wee

See all ideas
Trade directly on the supercharts through our supported, fully-verified and user-reviewed brokers.


Frequently Asked Questions
The current price of BBSI is 122.27 USD — it has increased by 0.75% in the past 24 hours.
Depending on the exchange, the stock ticker may vary. For instance, on NASDAQ exchange Barrett Business Services, Inc. stocks are traded under the ticker BBSI.
Barrett Business Services, Inc. is going to release the next earnings report on May 1, 2024. Keep track of upcoming events with our Earnings Calendar.
BBSI stock is 3.35% volatile and has beta coefficient of 1.08. Check out the list of the most volatile stocks — is Barrett Business Services, Inc. there?
One year price forecast for Barrett Business Services, Inc. has a max estimate of 159.00 USD and a min estimate of 135.00 USD.
BBSI earnings for the last quarter are 2.68 USD per share, whereas the estimation was 2.37 USD resulting in a 13.20% surprise. The estimated earnings for the next quarter are 1.90 USD per share. See more details about Barrett Business Services, Inc. earnings.
Barrett Business Services, Inc. revenue for the last quarter amounts to 273.30 M USD despite the estimated figure of 291.50 M USD. In the next quarter revenue is expected to reach 284.42 M USD.
Yes, you can track Barrett Business Services, Inc. financials in yearly and quarterly reports right on TradingView.
BBSI stock has risen by 2.04% compared to the previous week, the month change is a 1.17% rise, over the last year Barrett Business Services, Inc. has showed a 38.31% increase.
BBSI net income for the last quarter is 14.56 M USD, while the quarter before that showed 18.22 M USD of net income which accounts for −20.09% change. Track more Barrett Business Services, Inc. financial stats to get the full picture.
Today Barrett Business Services, Inc. has the market capitalization of 797.50 M, it has decreased by 1.77% over the last week.
Yes, BBSI dividends are paid quarterly. The last dividend per share was 0.30 USD. As of today, Dividend Yield (TTM)% is 0.99%. Tracking Barrett Business Services, Inc. dividends might help you take more informed decisions.
Barrett Business Services, Inc. dividend yield was 1.04% in 2023, and payout ratio reached 16.24%. The year before the numbers were 1.29% and 18.34% correspondingly. See high-dividend stocks and find more opportunities for your portfolio.
Like other stocks, BBSI shares are traded on stock exchanges, e.g. Nasdaq, Nyse, Euronext, and the easiest way to buy them is through an online stock broker. To do this, you need to open an account and follow a broker's procedures, then start trading. You can trade Barrett Business Services, Inc. stock right from TradingView charts — choose your broker and connect to your account.
As of Apr 19, 2024, the company has 130.51 K employees. See our rating of the largest employees — is Barrett Business Services, Inc. on this list?
Investing in stocks requires a comprehensive research: you should carefully study all the available data, e.g. company's financials, related news, and its technical analysis. So Barrett Business Services, Inc. technincal analysis shows the buy rating today, and its 1 week rating is buy. Since market conditions are prone to changes, it's worth looking a bit further into the future — according to the 1 month rating Barrett Business Services, Inc. stock shows the buy signal. See more of Barrett Business Services, Inc. technicals for a more comprehensive analysis.
If you're still not sure, try looking for inspiration in our curated watchlists.
If you're still not sure, try looking for inspiration in our curated watchlists.
We've gathered analysts' opinions on Barrett Business Services, Inc. future price: according to them, BBSI price has a max estimate of 159.00 USD and a min estimate of 135.00 USD. Read a more detailed Barrett Business Services, Inc. forecast: see what analysts think of Barrett Business Services, Inc. and suggest that you do with its stocks.
EBITDA measures a company's operating performance, its growth signifies an improvement in the efficiency of a company. Barrett Business Services, Inc. EBITDA is 73.03 M USD, and current EBITDA margin is 6.99%. See more stats in Barrett Business Services, Inc. financial statements.