TELADAN POWERPLAY + VCP Follow UpI shared the chart pattern on 6 Sep based on Powerplay setup.
This counter continue correction phase till now. The pattern is clearer now.
Left - POWERPLAY
Right - VCP (C1/C2)
C1: -13%
C2: -7%
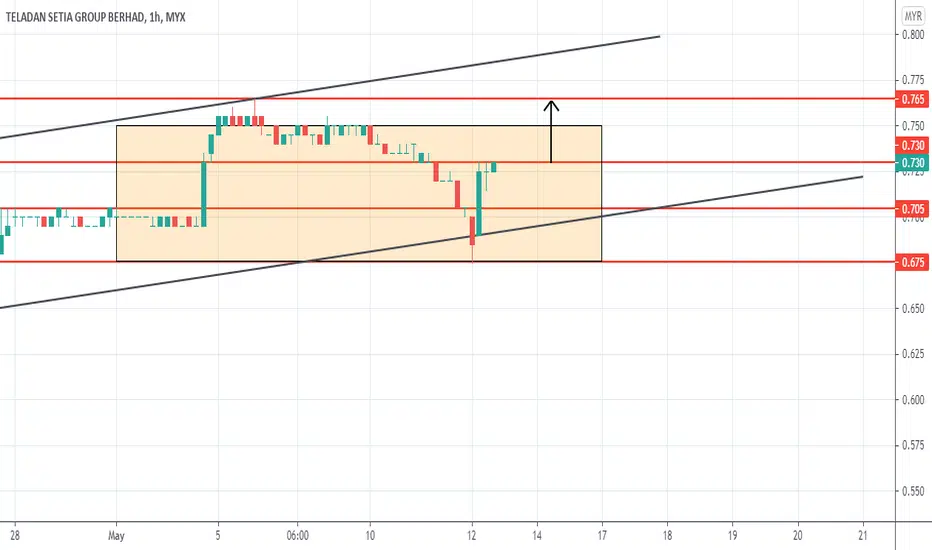
Price breakout on 26 Oct 2022. Price currently testing its new support (red horizontal line).
Its vol
0.035MYR
27.10 MMYR
275.08 MMYR
80.31 M
About TELADAN GROUP BERHAD
Sector
Industry
Headquarters
Batu Berendam
Website
Founded
1997
ISIN
MYQ0230OO001
FIGI
BBG00ZDSFMF5
Teladan Group Bhd. is an investment holding company, which engages in the development of residential and commercial properties. Its project portfolio includes buildings, offices, business centers, departmental stores, apartments, condominiums, houses, shopping malls, and retail and wholesale outlets. The company was founded by Poh Boon Teo in 1997 and is headquartered in Batu Berendam, Malaysia.

TELADAN LONGSL0.95 TP1 1.54 TP2 Open
SL0.95 TP1 1.54 TP2 Open
SL0.95 TP1 1.54 TP2 Open
SL0.95 TP1 1.54 TP2 Open
SL0.95 TP1 1.54 TP2 Open
SL0.95 TP1 1.54 TP2 Open
SL0.95 TP1 1.54 TP2 Open
SL0.95 TP1 1.54 TP2 Open
SL0.95 TP1 1.54 TP2 Open
SL0.95 TP1 1.54 TP2 Open

TELEDAN POWERPLAY?TELADAN setting up powerplay since end July. Price sideway for almost one month.
Will it breakout and go for another rally?
Disclaimer:
Information presented here is not intended to be used as the sole basis of any investment decisions nor should it be construed as advice designed to meet the inv

TELADAN SETIA - SLOW AND STEADY RISE1. Tenkan above Kijunsen
2. Chikou Span breaking free of price zone
3. Price moving above Tenkan and Kijunsen
4. Buyers' market the past three days.
5. Price has now entered Bearish Kumo Cloud, going up.
Outlook: If the buyer sentiment continues into next week, and Teladan clears 0.65, it should

TELADAN: POSSIBLE TESTING RESISTANT LINETELADAN is on very good opportunity to go up to test near resistance level in the near term.
TAYOR!
3 Malaysia Stocks About To Start A Bull RunFind out how to participate at the beginning of the potential bull run for these 3 Malaysia stocks - MYX:JFTECH , MYX:LUXCHEM & MYX:TELADAN .

See all ideas
Trade directly on the supercharts through our supported, fully-verified and user-reviewed brokers.


Frequently Asked Questions
The current price of TELADAN is 1.020 MYR — it has decreased by 2.86% in the past 24 hours.
Depending on the exchange, the stock ticker may vary. For instance, on MYX exchange TELADAN GROUP BERHAD stocks are traded under the ticker TELADAN.
TELADAN stock is 2.94% volatile and has beta coefficient of 0.06. Check out the list of the most volatile stocks — is TELADAN GROUP BERHAD there?
Yes, you can track TELADAN GROUP BERHAD financials in yearly and quarterly reports right on TradingView.
TELADAN stock has fallen by 8.93% compared to the previous week, the month change is a 11.30% fall, over the last year TELADAN GROUP BERHAD has showed a 14.29% decrease.
TELADAN net income for the last quarter is 3.16 M MYR, while the quarter before that showed 7.61 M MYR of net income which accounts for −58.51% change. Track more TELADAN GROUP BERHAD financial stats to get the full picture.
Today TELADAN GROUP BERHAD has the market capitalization of 853.09 M, it has decreased by 2.69% over the last week.
Like other stocks, TELADAN shares are traded on stock exchanges, e.g. Nasdaq, Nyse, Euronext, and the easiest way to buy them is through an online stock broker. To do this, you need to open an account and follow a broker's procedures, then start trading. You can trade TELADAN GROUP BERHAD stock right from TradingView charts — choose your broker and connect to your account.
Investing in stocks requires a comprehensive research: you should carefully study all the available data, e.g. company's financials, related news, and its technical analysis. So TELADAN GROUP BERHAD technincal analysis shows the strong sell today, and its 1 week rating is sell. Since market conditions are prone to changes, it's worth looking a bit further into the future — according to the 1 month rating TELADAN GROUP BERHAD stock shows the sell signal. See more of TELADAN GROUP BERHAD technicals for a more comprehensive analysis.
If you're still not sure, try looking for inspiration in our curated watchlists.
If you're still not sure, try looking for inspiration in our curated watchlists.
EBITDA measures a company's operating performance, its growth signifies an improvement in the efficiency of a company. TELADAN GROUP BERHAD EBITDA is 42.96 M MYR, and current EBITDA margin is 15.62%. See more stats in TELADAN GROUP BERHAD financial statements.