−0.040MYR
−22.59 MMYR
47.89 MMYR
752.55 M
About NEXGRAM HOLDINGS BERHAD
Sector
Industry
Headquarters
Kuala Lumpur
Website
Founded
1999
ISIN
MYQ0096OO006
FIGI
BBG000DQ15R5
Nexgram Holdings Bhd. operates as an investment holding company. The firm engages in the research and development of telecommunication software solutions. It operates through the following segments: Investment Holding, Information Technology Services (ICT), Property Investment, Logistics and Healthcare. The Investment Holding segment engages in the investment in companies. The Information Technology Services (ICT) segment offers communications and software services. The Property Investment segment consists of property development, property investment and management. The Logistics segment consists of shipping. The Healthcare segment consists of medical equipment. The company was founded by Por Chen Tey, Por Yee Tey and Poh Yee See in 1999 and is headquartered in Kuala Lumpur, Malaysia.


NEXGRAMBackground of company:
provide a wide range of products and services in different business segments. Today The Group involves in businesses such as telecommunication, information technology, property development, industries, and corporate advisory services. Latest, involve in plastic manufacture fo


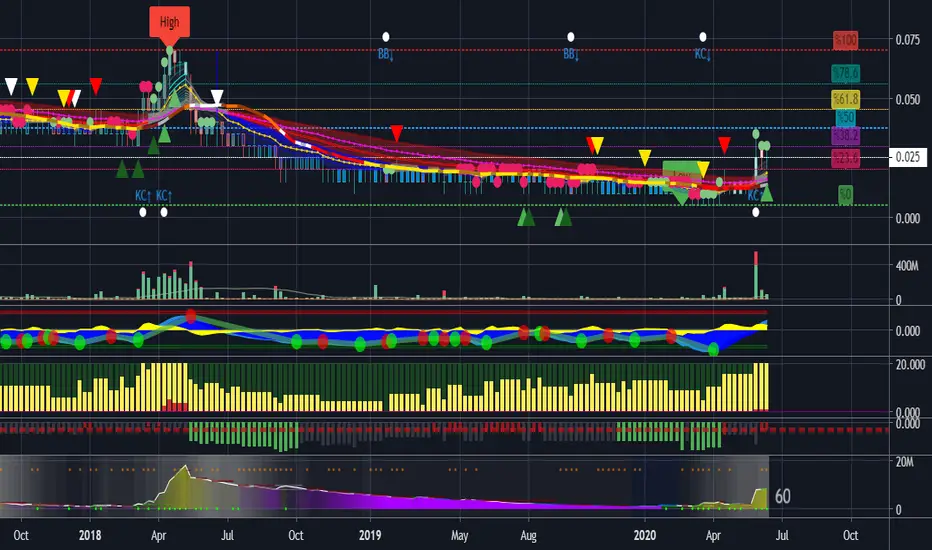
Nexgram! Worth it...24th July sudden interest really draws other investors to pump their capital into Nexgram and temporarily push the price until 0.070, then at the closed at 0.055. Recent rumors about Tri-G that is Nexgram subsidiary got a contract from the ministry of tourism posted on 24th will surely push the pric


See all ideas
Trade directly on the supercharts through our supported, fully-verified and user-reviewed brokers.


Frequently Asked Questions
The current price of NEXGRAM is 0.025 MYR — it hasn't changed in the past 24 hours.
Depending on the exchange, the stock ticker may vary. For instance, on MYX exchange NEXGRAM HOLDINGS BERHAD stocks are traded under the ticker NEXGRAM.
NEXGRAM HOLDINGS BERHAD is going to release the next earnings report on Jun 26, 2024. Keep track of upcoming events with our Earnings Calendar.
NEXGRAM stock is 20.00% volatile and has beta coefficient of 1.36. Check out the list of the most volatile stocks — is NEXGRAM HOLDINGS BERHAD there?
Yes, you can track NEXGRAM HOLDINGS BERHAD financials in yearly and quarterly reports right on TradingView.
NEXGRAM stock has fallen by 16.67% compared to the previous week, the month change is a 28.57% fall, over the last year NEXGRAM HOLDINGS BERHAD has showed a 16.67% decrease.
NEXGRAM net income for the last quarter is −5.24 M MYR, while the quarter before that showed 1.69 M MYR of net income which accounts for −409.88% change. Track more NEXGRAM HOLDINGS BERHAD financial stats to get the full picture.
Today NEXGRAM HOLDINGS BERHAD has the market capitalization of 20.38 M, it has increased by 24.00% over the last week.
No, NEXGRAM doesn't pay any dividends to its shareholders. But don't worry, we've prepared a list of high-dividend stocks for you.
Like other stocks, NEXGRAM shares are traded on stock exchanges, e.g. Nasdaq, Nyse, Euronext, and the easiest way to buy them is through an online stock broker. To do this, you need to open an account and follow a broker's procedures, then start trading. You can trade NEXGRAM HOLDINGS BERHAD stock right from TradingView charts — choose your broker and connect to your account.
Investing in stocks requires a comprehensive research: you should carefully study all the available data, e.g. company's financials, related news, and its technical analysis. So NEXGRAM HOLDINGS BERHAD technincal analysis shows the sell today, and its 1 week rating is strong sell. Since market conditions are prone to changes, it's worth looking a bit further into the future — according to the 1 month rating NEXGRAM HOLDINGS BERHAD stock shows the sell signal. See more of NEXGRAM HOLDINGS BERHAD technicals for a more comprehensive analysis.
If you're still not sure, try looking for inspiration in our curated watchlists.
If you're still not sure, try looking for inspiration in our curated watchlists.
EBITDA measures a company's operating performance, its growth signifies an improvement in the efficiency of a company. NEXGRAM HOLDINGS BERHAD EBITDA is −12.15 M MYR, and current EBITDA margin is −36.03%. See more stats in NEXGRAM HOLDINGS BERHAD financial statements.