−0.020MYR
−49.34 MMYR
287.57 MMYR
1.06 B
About ADVANCE SYNERGY BHD
Sector
Industry
CEO
Su Nie Lee
Website
Headquarters
Shah Alam
Founded
1920
ISIN
MYL1481OO000
FIGI
BBG000BL8XX3
Advance Synergy Bhd. is an investment holding company, which engages in the provision of corporate and financial support to its subsidiaries. It operates through the following business segments: Investment Holding; Property Development; Hotels and Resorts; Information and Communications Technology; Travel and Tours; and Others. The Investment Holding segment provides full corporate and financial support to the company. The Property Development segment develops residential and commercial properties. The Hotels and Resorts segment comprises of the operation and management of hotels and resorts. The Information and Communications Technology segment designs and develops telecommunications software applications and systems. The Travel and Tours segment operates as a travel and tour agent and engages in the money services business. The Others segment includes design, building, and fabrication of coaches and bus maintenance and related services; trading, payment card issuing, and acquiring services; and operation of a language center. The company was founded on June 5, 1920 and is headquartered in Shah Alam, Malaysia.

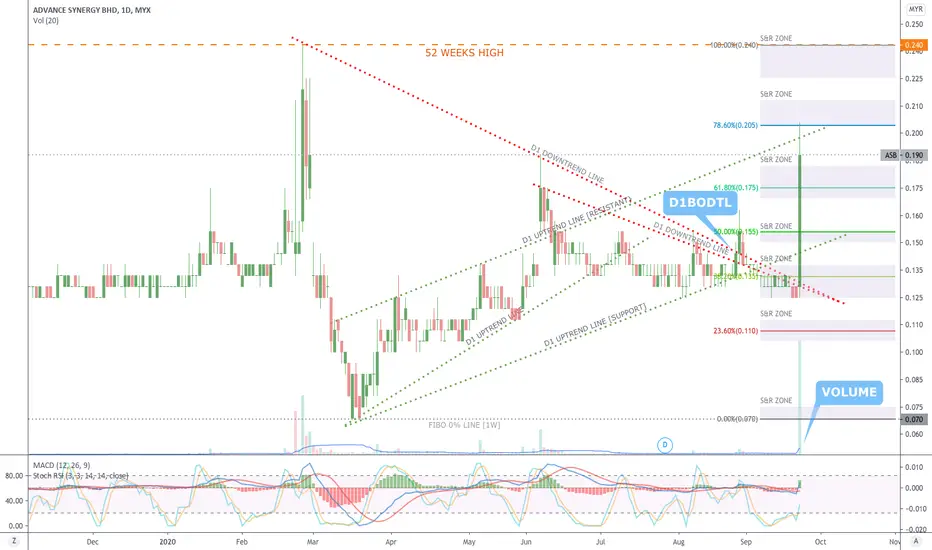
ASB, preparing to lift off?ASB after a month of side way, these 3 trading day has increased its volume and break out from the price 0.170.
We can see from Fibo retracement, it has been settled down above 70.5% or EMA25 line.
On RSI indicator, we can see it is starting crossing up from 14 days average line and pointing up


A Breakout Signal!The candlestick indicates a breakout signal due to significant price movement backed by high volume with the price closed above the MA50 line.
The MACD signal is in a positive trend, hence, confirming the price uptrend toward the next price resistance.
The RSI cross-up of the indexer 70 indexer du

Bursa ASB - Potential Entry PriceDisclaimer: If you choose to follow this trading idea you do so at your own risk after giving thorough and reasonable thought and consideration to your actions. All trading is high risk and one of the most difficult activities you will ever consider. Don’t trade with money you can’t afford to lose.


EASY123 Prediction @MYX ASBPrediction: SIDEWAY to Rally (When it breaks 0.155)
Target Price: R1=0.155, R2=0.18-0.19, R3=0.22-0.25
Support/Cut Loss: S1=0.125, S2=0.11
*Trend direction: SIDEWAY- Price move along at strong support Lifeline (Redline)
*Turning points (White-candle) have appeared on 06-Aug, an indication of the pr

ASB (1481)Currently trading at RM 0.125.
Immediate support found at RM 0.120 at middle channel, as beginning of year 2018 already retest this level.
So I expecting the price will bounce back from this level to resume the new uptrend.
If price fall below RM 0.100 will be rate as risky counter.
Target - RM 0

ASB (1481)MYX:1481
ASB currently trading at RM 0.140. Price consolidation more than one year since last year April from the highest price level at RM 0.210.
RM 0.120 is the bottom and last price for the consolidation mode. If fail to support, it might go back to RM 0.100, but seems like unlikely to break

See all ideas
Trade directly on the supercharts through our supported, fully-verified and user-reviewed brokers.


Frequently Asked Questions
The current price of ASB is 0.105 MYR — it has increased by 5.00% in the past 24 hours.
Depending on the exchange, the stock ticker may vary. For instance, on MYX exchange ADVANCE SYNERGY BHD stocks are traded under the ticker ASB.
ASB stock is 5.00% volatile and has beta coefficient of 1.50. Check out the list of the most volatile stocks — is ADVANCE SYNERGY BHD there?
Yes, you can track ADVANCE SYNERGY BHD financials in yearly and quarterly reports right on TradingView.
ASB stock has fallen by 4.55% compared to the previous week, the month change is a 4.55% fall, over the last year ADVANCE SYNERGY BHD has showed a 19.23% decrease.
ASB net income for the last quarter is −38.96 M MYR, while the quarter before that showed −2.65 M MYR of net income which accounts for −1.37 K% change. Track more ADVANCE SYNERGY BHD financial stats to get the full picture.
Yes, ASB dividends are paid annually. The last dividend per share was 0.00 MYR. As of today, Dividend Yield (TTM)% is 1.00%. Tracking ADVANCE SYNERGY BHD dividends might help you take more informed decisions.
Like other stocks, ASB shares are traded on stock exchanges, e.g. Nasdaq, Nyse, Euronext, and the easiest way to buy them is through an online stock broker. To do this, you need to open an account and follow a broker's procedures, then start trading. You can trade ADVANCE SYNERGY BHD stock right from TradingView charts — choose your broker and connect to your account.
Investing in stocks requires a comprehensive research: you should carefully study all the available data, e.g. company's financials, related news, and its technical analysis. So ADVANCE SYNERGY BHD technincal analysis shows the sell today, and its 1 week rating is strong sell. Since market conditions are prone to changes, it's worth looking a bit further into the future — according to the 1 month rating ADVANCE SYNERGY BHD stock shows the strong sell signal. See more of ADVANCE SYNERGY BHD technicals for a more comprehensive analysis.
If you're still not sure, try looking for inspiration in our curated watchlists.
If you're still not sure, try looking for inspiration in our curated watchlists.