THOUGHTS ON GBP/USD PAIRGBP/USD 1D - As you can see price has been extremely bullish as of recent and I feel this structure is here to say. Following a full top down analysis, I have the bias that this market is ready to put in a higher timeframe bullish correction.
As we know the bias of this market overall is a bearish one however price is looking very strong at the moment and we have seen a few patterns form that are suggesting a correction now to the upside.
What we are seeing at the moment is that price is correcting fractally to the downside, this is a correction within a correction. Price is trading lower, correcting itself before the next bullish impulse which is part of the higher timeframe bullish correction.
Its important that we can distinguish structure within structure, and apply a top down analysis correctly. I will be looking for longs as soon as we have confirmation of a new bull run. I will keep you all updated.
GBPUSD trade ideas

GBPUSD SHORT FORECAST Q2 W18 D1 Y25GBPUSD SHORT FORECAST Q2 W18 D1 Y25
Professional Risk Managers👋
Welcome back to another FRGNT chart update📈
Diving into some Forex setups using predominantly higher time frame order blocks alongside confirmation breaks of structure.
Let’s see what price action is telling us today!
💡Here are some trade confluences📝
✅Weekly order block rejection
✅Daily order block rejection
✅Daily high rejection
✅Daily imbalance fill targets
🔑 Remember, to participate in trading comes always with a degree of risk, therefore as professional risk managers it remains vital that we stick to our risk management plan as well as our trading strategies.
📈The rest, we leave to the balance of probabilities.
💡Fail to plan. Plan to fail.
🏆It has always been that simple.
❤️Good luck with your trading journey, I shall see you at the very top.
🎯Trade consistent, FRGNT X

GBPUSD – Short-Term Upside RetestGBPUSD – Short-Term Upside Retest
📈 Long Bias | 🎯 Target: 1.33181 | ⏳ Deadline: May 1
After extended downside pressure, price is showing signs of curling back toward the prior breakdown area near 1.33181. Watching this level closely as a short-term magnet on the lower timeframes. I am in.
💡 All trades can be replayed on TradingView for learning and review.
#GBPUSD #Forex #PriceAction #MarketSetup #TradingView #GlobalHorns

GBPUSD... Chat pattern 4HYou're suggesting a *GBP/USD short (sell) trade* at *1.3305, targeting **1.30951*. Here’s a quick trade outline and some thoughts:
### *Trade Idea*
- *Entry (Sell):* 1.3305
- *Take Profit (TP):* 1.30951
- *Potential Gain:* ~209 pips
### *Key Considerations*
1. *Trend Direction:* Check if the pair is in a downtrend (lower highs/lows on H4/D1).
2. *Resistance Area:* Is 1.3305 a recent resistance or part of a reversal pattern?
3. *Fundamentals:* Any upcoming UK or US news (e.g., interest rate decisions, NFP)?
4. *Risk Management:* Use a stop-loss—possibly above recent highs (e.g., 1.3350 or higher), depending on your risk tolerance.

GBPUSD Dual Set-Up LondonMarket Setup & Key Levels
SSL Liquidity Sweep:
The recent liquidity sweep occurred at 1.32790—this move cleared downside stops and set the stage for a reversal.
- Bullish Breaker Block:
The breaker is identified at 1.32845. This area now acts as a support/entry zone where institutional buyers have stepped in.
-15-min SIBI Target/ 1hr order block :
A key imbalance (SIBI) was left during the Asian session on the 15‑minute chart which coincides with a 1hr OB. This zone represents where liquidity might be harvested.
- Alternate Idea : If price surges to this SIBI target without offering a pullback, it could signal an overextended move—potentially setting up a short trade opportunity.
---
Primary Trade: Long on the Breaker Retest
1. Entry :
- Buy on Retest:Plan to enter long when price retests the bullish breaker zone at 1.32845 and shows clear rejection signals.
- Confirmation :Look for lower timeframe (5‑min or even 1‑min) reversal candlestick patterns (such as a pin bar or engulfing pattern) confirming that the breaker is holding as support or ifvg and break of structure.
2. Stop-Loss :
- Place your stop-loss just below the breaker zone. For instance, around 1.32750 (or a level that protects you from further downside beyond the liquidity sweep)
3. Profit Target:
- Use the 15‑minute SIBI zone as your primary profit target.
- Alternatively, trail your stops if the market shows strong momentum upward.
---
Alternate Trade : Short if Price Reaches the SIBI Without a Pullback**
1. Scenario :
- If price drives directly toward the 15‑minute SIBI target without offering a clear pullback or reversal near the breaker, the move may become overextended.
2. Entry for Short Trade :
- Look for signs of exhaustion or a reversal as price touches the SIBI zone.
- Enter short when you see confirmation of a rejection (for example, a bearish candle pattern or a failure to hold momentum).
3. Stop-Loss :
- Set your stop just above the SIBI zone to limit risk if the rejection fails.
4.Profit Target:
- Target zones near the breaker or further liquidity levels that might be revisited during the subsequent retracement.


Bullish Rebound in Action: GBP/USD Bounces Off Key Demand Zone!Timeframe: 1-Hour (H1)
Ideal for short to medium-term intraday trades.
Support Zone (Entry):
Price bounced from a strong demand zone around 1.32800, suggesting a potential long entry.
Stop Loss:
Just below the green zone at approx. 1.32700
Target:
Resistance zone marked around 1.34500, offering high upside potential.
Bullish Price Action:
Strong bounce candle at support — indicating demand pressure and a possible reversal.
Favorable Risk-to-Reward:
Wide profit zone relative to stop loss, high RRR setup.

GBPUSD STRONG BEARISH PATTERN (H4)Bearish Scenario for GBP/USD
Current Sentiment: The GBP/USD market is displaying a continuous bearish pattern, indicating strong selling pressure. Price action suggests that bears are in control, pushing the pair lower through support levels.
Entry: Price is currently trending downwards after a potential lower high formation, breaking key support zones.
Bearish Targets:
1st Target: 1.32000 – This level aligns with a minor support area where previous consolidation occurred. A breach here confirms continued selling momentum.
2nd Target: 1.30600 – Historical support level; expect a potential short-term bounce or consolidation.
Final Target: 1.28100 – Major support level from previous long-term lows. A break below this could signal a shift in the broader market structure.

GBPUSD Analysis – Classic Spike, But Bearish Bias HoldsTwo days ago, TRADENATION:GBPUSD did what it often does – spiked above the previous high with no solid fundamental reason, likely just to hunt stops.
This return into the resistance zone might look bullish on the surface, but the bigger picture remains unchanged.
Has the market really resumed its up move, or was this just a trap?
Despite the upward push, the overall outlook stays bearish. A drop towards the 1.3000 zone is still highly probable – but we need confirmation.
Why the bearish scenario remains valid:
• The spike occurred without strong fundamental backing.
• Price hasn't broken the strong 1.35 resistance.
• Key support for a breakdown lies at 1.3330–1.3350 – a clear break here is the signal for downside continuation.
Trading Plan:
Wait for a break below 1.3330–1.3350, and then look for short setups on lower timeframes.
Invalidation comes only if the pair pushes and sustains above 1.3500, in which case the bearish thesis is off the table.
Disclosure: I am part of Trade Nation's Influencer program and receive a monthly fee for using their TradingView charts in my analyses and educational articles.

Thu 1st May 2025 GBP/USD Daily Forex Chart Sell SetupGood morning fellow traders. On my Daily Forex charts using the High Probability & Divergence trading methods from my books, I have identified a new trade setup this morning. As usual, you can read my notes on the chart for my thoughts on this setup. The trade being a GBP/USD Sell. Enjoy the day all. Cheers. Jim


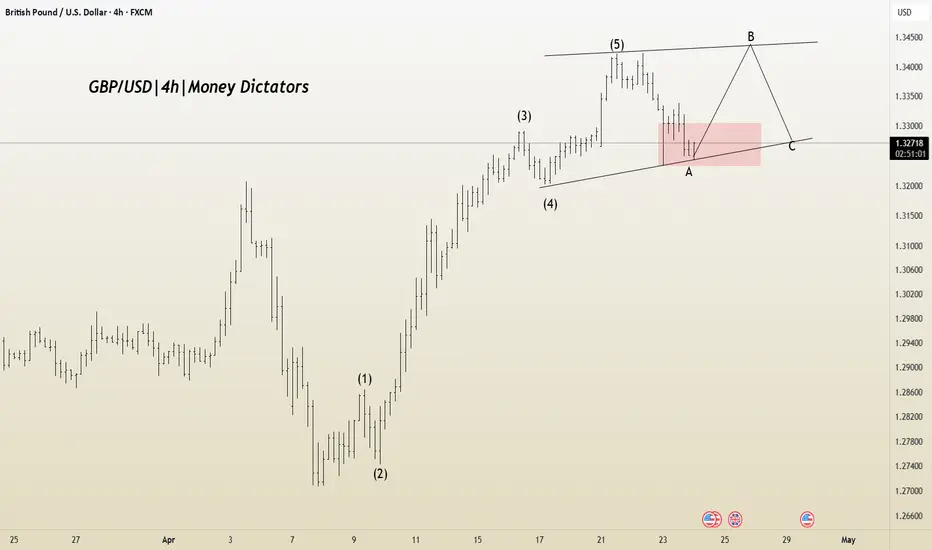
GBP/USD at a Turning Point – Correction Pattern in PlayIt appears that corrective Wave A in the GBP/USD pair is nearing completion, and Wave B may be forming. The Wave 1 to 5 structure seems to have been completed, indicating the beginning of an A-B-C corrective phase.
If the correction unfolds as expected, potential upside targets are 1.32918 and 1.33555. However, if the market faces rejection below the trendline, the stop-loss level would be 1.32021.
GBPUSD I Weekly CLS, KL - M OB, Model 1 , Target 50% CLSHey, Market Warriors, here is another outlook on this instrument
If you’ve been following me, you already know every setup you see is built around a CLS range, a Key Level, Liquidity and a specific execution model.
If you haven't followed me yet, start now.
My trading system is completely mechanical — designed to remove emotions, opinions, and impulsive decisions. No messy diagonal lines. No random drawings. Just clarity, structure, and execution.
🧩 What is CLS?
CLS is real smart money — the combined power of major investment banks and central banks moving over 6.5 trillion dollars a day. Understanding their operations is key to markets.
✅ Understanding the behaviour of CLS allows you to position yourself with the giants during the market manipulations — leading to buying lows and selling highs - cleaner entries, clearer exits, and consistent profits.
🛡️ Models 1 and 2:
From my posts, you can learn two core execution models.
They are the backbone of how I trade and how my students are trained.
📍 Model 1
is right after the manipulation of the CLS candle when CIOD occurs, and we are targeting 50% of the CLS range. H4 CLS ranges supported by HTF go straight to the opposing range.
📍 Model 2
occurs in the specific market sequence when CLS smart money needs to re-accumulate more positions, and we are looking to find a key level around 61.8 fib retracement and target the opposing side of the range.
👍 Hit like if you find this analysis helpful, and don't hesitate to comment with your opinions, charts or any questions.
⚔️ Listen Carefully:
Analysis is not trading. Right now, this platform is full of gurus" trying to sell you dreams based on analysis with arrows while they don't even have the skill to trade themselves.
If you’re ever thinking about buying a Trading Course or Signals from anyone. Always demand a verified track record. It takes less than five minutes to connect 3rd third-party verification tool and link to the widget to his signature.
"Adapt what is useful, reject what is useless, and add what is specifically your own."
— David Perk aka Dave FX Hunter ⚔️

GBPUSD MAINTAINS BULLISH MOMENTUM Price successfully closed above the price of 1.30000 area from the daily timeframe perspective. A buy opportunity is envisaged from the current market price ahead of the volatility we may experience this coming month of May. Position for that amazing opportunity that’s coming

GBPUSD...4hchatpatternYou're looking at a GBP/USD *short (sell) trade* with the following parameters:
- *Entry:* 1.3343
- *1st Take Profit (TP1):* 1.30045
- *2nd Take Profit (TP2):* 1.29270
Here’s a quick analysis based on this setup:
### Risk-Reward Snapshot:
- *TP1* distance: ~339 pips
- *TP2* distance: ~416 pips
- These targets suggest a medium- to long-term bearish outlook on GBP/USD.
### Considerations:
- Check for *support levels* around 1.3000 – it’s a psychological level and could cause a bounce.
- Watch for upcoming *economic news* (e.g., UK inflation data, BoE/Fed decisions) which may heavily impact volatility.
- *Stop-loss* is not mentioned — consider setting one based on recent highs or ATR (Average True Range) to manage risk.
Would you like a technical chart review or news-based outlook for GBP/USD to support this trade idea?

Bullish bounce?GBP/USD has bounced off the support level which is a pullback support that lines up wit the 71% Fibonacci retracement and could rise from this level to our take profit.
Entry: 1.3321
Why we like it:
There is a pullback support level that lines up with the 71% Fibonacci retracement.
Stop loss: 1.3281
Why we like it:
There is a pullback support level.
Take profit: 1.3385
Why we like it:
There is a pullback resistance level that is slightly above the 50% Fibonacci retracement.
Enjoying your TradingView experience? Review us!
Please be advised that the information presented on TradingView is provided to Vantage (‘Vantage Global Limited’, ‘we’) by a third-party provider (‘Everest Fortune Group’). Please be reminded that you are solely responsible for the trading decisions on your account. There is a very high degree of risk involved in trading. Any information and/or content is intended entirely for research, educational and informational purposes only and does not constitute investment or consultation advice or investment strategy. The information is not tailored to the investment needs of any specific person and therefore does not involve a consideration of any of the investment objectives, financial situation or needs of any viewer that may receive it. Kindly also note that past performance is not a reliable indicator of future results. Actual results may differ materially from those anticipated in forward-looking or past performance statements. We assume no liability as to the accuracy or completeness of any of the information and/or content provided herein and the Company cannot be held responsible for any omission, mistake nor for any loss or damage including without limitation to any loss of profit which may arise from reliance on any information supplied by Everest Fortune Group.


GBPUSD Possible Reversal to the upside. Setup Overview:
- Buy Zone At the 5-min breaker block around 1.33240 (breaker block left after sweeping a previous liquidity low).
- Target:Anticipate price movement to higher liquidity areas if the breaker is respected.
- Rationale: Price has swept liquidity below the NWOG High and sharply reversed toward the 4-hour C.E at 1.33225, leaving IFVGs. A revisit to the breaker zone offers an optimal buying opportunity within the silver bullet window.
Timeframe: 5-min & 1-min Confirmation
Key Levels:
- Entry: 1.33240 (Breaker Block)
- S.L.: 1.33200
- T.P.: 1.33225 (4hr C.E)
Rationale:
- Price has swept liquidity at NWOG High (1.33100).
- A sharp move left IFVGs during the push toward the 4-hour C.E, indicating institutional footprints.
- The breaker block at 1.33240 is expected to act as a launch point for higher prices.
If price decides to target the New Week Opening Gap low we are cooked.

GBPUSD Wave Analysis – 30 April 2025
- GBPUSD reversed from the long-term resistance level 1.3430
- Likely to fall to support level 1.3200
GBPUSD currency pair recently reversed down from the long-term resistance level 1.3430 (previous yearly high from last year) standing close to the upper daily and weekly Bollinger Bands.
The price also earlier reversed down from the resistance level 1.3430 creating the weekly Shooting Star last week.
Given the overbought weekly Stochastic and the strength of the resistance level 1.3430, GBPUSD currency pair can be expected to fall to the next support level 1.3200.

GBPUSD: First red dayHello traders and welcome back on this analysis regarding GBPUSD, as always I never try to predict the direction of the market, long and short are only the setup I'm currently looking for, during the day.
I use technical analysis exclusively to find a proper risk reward for my trades, eventually I position myself in the market.
GBPUSD looks currently pretty interesting to me, and I'm looking to complete a pump and dump template started on Monday.
Just few words about the previous week, the previous Tuesday which placed the weekly high, it's a level which began an interesting bearish move, and currently the market is retesting that level.
The previous Tuesday and Wednesday placed the weekly range, and I'm gonna see how the price will behave on the extreme.
This week, last week of April, I can see on Monday a strong impulsive move, which is our pump for the weekly template, the market triggered long breakout traders and closed as well above the previous week high, other time frames/big players are involved on further movements.
Tuesday, the market stayed pretty much inside, it kinda triggered the daily high, but the most important signal to me, is that it closed as a first red day after a full day of consolidation up high.
Today, a bearish move looks like has already started, but considering still plenty of space down low, I can still be looking for further downward move.
Major red news are on schedule at 10am NYT, so no action will be taken before that time.
However I will be looking for the market to pump up 25/50pip, coiling for an explosive bearish move, targeting the low of Monday (which would eventually complete the weekly pump and dump), and potentially trailing a partial even lower.
I will update this post after the news at 10am NYT
Gianni

