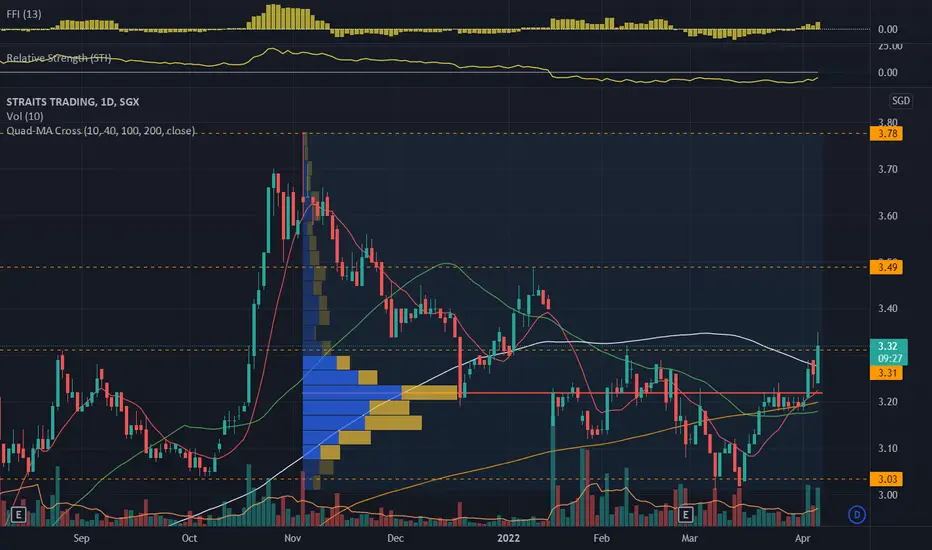
S20.SGX_Breakout Trade_LongENTRY: 3.32
SL: 3.18
TP1: 3.49
TP2: 3.78
- ADX>20
- Daily RS -ve
- Daily FFI +ve
- Weekly RS +ve
- Weekly FFI +ve
- Breakout from consolidation and HVN on 4 Apr 2022 with high volume
- Breakout 3.31 resistance with high volume today for added confirmation of uptrend
−0.045EUR
−19.60 MEUR
337.38 MEUR
127.31 M
About STRAITS TRADG SD 1
Sector
Industry
Headquarters
Singapore
Website
Employees (FY)
127
Founded
1887
ISIN
SG1J49001550
FIGI
BBG00Z8LPZN7
The Straits Trading Co. Ltd. is an investment holding company engaged in the provision of real estate, hospitality, resources and investment activities. It operates through the following segments: Resources, Real Estate, Hospitality and Others. The Resources segment includes smelting of tin concentrates and tin bearing materials, the production of various grades of refined tin metal, and the sale and delivery of refined tin metal and by products, as well as investments in other metals and mineral resources. The Real Estate segment comprises of property investment, sales and leasing and property development. The Hospitality segment focuses on hotel ownership and hotel management. The Others segment engages in the provision of group-level corporate and treasury services. The company was founded by James Sword and Herman Muhlinghaus on November 8, 1887 and is headquartered in Singapore.

S20.SGX_LongENTRY: 2.09
TP1: 2.15
TP2: 2.21
SL: 2.00
- ADX>25
- RSI>70
- FFI and RS +ve
- MA are aligned
- Breakout with good volume

S20.SGX_LongENTRY: 1.88
TP: 2
SL: 1.8
- RSI>70
- ADX>25
- 10MA, 40MA and 100MA aligned
- 200MA pointing down but looks like flattening
- Good break-up with volume today

See all ideas
Trade directly on the supercharts through our supported, fully-verified and user-reviewed brokers.


Frequently Asked Questions
The current price of W2F is 0.955 EUR — it has decreased by 0.52% in the past 24 hours.
Depending on the exchange, the stock ticker may vary. For instance, on FWB exchange STRAITS TRADG SD 1 stocks are traded under the ticker W2F.
STRAITS TRADG SD 1 is going to release the next earnings report on Aug 15, 2024. Keep track of upcoming events with our Earnings Calendar.
W2F stock is 0.52% volatile and has beta coefficient of 0.56. Check out the list of the most volatile stocks — is STRAITS TRADG SD 1 there?
Yes, you can track STRAITS TRADG SD 1 financials in yearly and quarterly reports right on TradingView.
W2F stock has fallen by 0.52% compared to the previous week, the month change is a 4.02% fall, over the last year STRAITS TRADG SD 1 has showed a 33.68% decrease.
W2F net income for the last quarter is −29.83 M EUR, while the quarter before that showed 10.10 M EUR of net income which accounts for −395.44% change. Track more STRAITS TRADG SD 1 financial stats to get the full picture.
Today STRAITS TRADG SD 1 has the market capitalization of 440.01 M, it has increased by 0.58% over the last week.
Yes, W2F dividends are paid annually. The last dividend per share was 0.05 EUR. As of today, Dividend Yield (TTM)% is 5.59%. Tracking STRAITS TRADG SD 1 dividends might help you take more informed decisions.
Like other stocks, W2F shares are traded on stock exchanges, e.g. Nasdaq, Nyse, Euronext, and the easiest way to buy them is through an online stock broker. To do this, you need to open an account and follow a broker's procedures, then start trading. You can trade STRAITS TRADG SD 1 stock right from TradingView charts — choose your broker and connect to your account.
As of Apr 25, 2024, the company has 127.00 employees. See our rating of the largest employees — is STRAITS TRADG SD 1 on this list?
Investing in stocks requires a comprehensive research: you should carefully study all the available data, e.g. company's financials, related news, and its technical analysis. So STRAITS TRADG SD 1 technincal analysis shows the sell today, and its 1 week rating is sell. Since market conditions are prone to changes, it's worth looking a bit further into the future — according to the 1 month rating STRAITS TRADG SD 1 stock shows the sell signal. See more of STRAITS TRADG SD 1 technicals for a more comprehensive analysis.
If you're still not sure, try looking for inspiration in our curated watchlists.
If you're still not sure, try looking for inspiration in our curated watchlists.
EBITDA measures a company's operating performance, its growth signifies an improvement in the efficiency of a company. STRAITS TRADG SD 1 EBITDA is 40.83 M EUR, and current EBITDA margin is 11.79%. See more stats in STRAITS TRADG SD 1 financial statements.