NU SKIN Stock Chart Fibonacci Analysis 012324Trading Idea
1) Find a FIBO slingshot
2) Check FIBO 61.80% level
3) Entry Point > 18/61.80%
Chart time frame : B
A) 15 min(1W-3M)
B) 1 hr(3M-6M)
C) 4 hr(6M-1year)
D) 1 day(1-3years)
Stock progress : A
A) Keep rising over 61.80% resistance
B) 61.80% resistance
C) Hit the bottom
D) Hit the top
S
0.2EUR
7.79 MEUR
1.78 BEUR
48.17 M
About NU SKIN ENTERPRISES A
Sector
Industry
CEO
Ryan S. Napierski
Website
Headquarters
Provo
Employees (FY)
15.2 K
Founded
1984
ISIN
US67018T1051
FIGI
BBG000JFGPZ4
Nu Skin Enterprises, Inc. is a holding company, which engages in the development and distribution of beauty and wellness solutions. It operates through the following segments: Mainland China, Americas, South Korea, Southeast Asia/Pacific, EMEA, Japan, Hong Kong/Taiwan, Nu Skin Other, Manufacturing, and Rhyz Other. The company was founded by Blake M. Roney, Sandra N. Tillotson, and Steven J. Lund in 1984 and is headquartered in Provo, UT.

Trading Idea - #NuSkinMy trading idea for - Nu Skin - BUY based on strong seasonality!
Entry: 40.00 USD
Target: 44.00 USD (+10% profit)
Nu Skin Enterprises is a direct sales company for health and beauty products.
I am buying a position in Nu Skin because of its strong seasonality.
In the period May to early August,

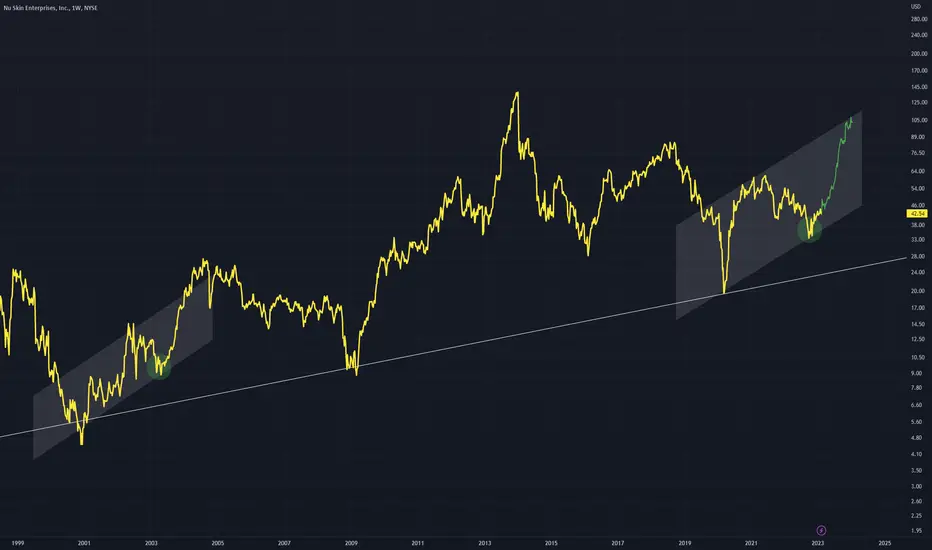
NUS - Comparing Two Channels Similar channels can be seen on chart
Similar points also can be seen in green circles
Using this comparison we can expect a rise coming on the latest channel.
Bullish above the dominant trend line in white.
NUS could be bearish and fast if break downTHE CONSISTENT TRADES analyze EL as a bearish /weak fundamental stock and therefore would be traded only in a short position.
NUS is in a triangle and is close to all major MA which could be an indication of a strong move soon. A breakdown below the red dotted line would be triggered for a short po

NUS daily - inside in big rising wedge - bearishNUS daily - even though NUS is above BigRed (200 days MA) is close to a breakout of a big rising wenge which is a very bearish pattern.
Volume is neutral to bearish because this whole leg up is on volume below 20 days average volume.
At the moment NUS is above all major MA (8, 20, 50, and 200) whi

NU skin enterprises nasdaq long position bullish indication
higher high higher low
green candles
crossed resistance level
head and shoulder chart pattern
plan
buy 49.46
stoploss 46.58
tp1 52.01
tp2 54.12

Head and Shoulders pattern on NUSSo far I see a decent H&S Pattern on Symbol NUS so it could be a great opportunity for a trend reversal. Not Financial advise just my opinion Trade at your own risk. I will update this as it develops and hopefully continues in bullish pattern. Please feel free to comment and share Ideas.

NUS LONG USING PVSRA - ANALYSIS BOTH D AND W CHARTSI used PVSRA to spot the accumulation (see the colored candles) with notable volume that you can see at the volume bar.
I see a great chance for this stock to go up until the next earnings announcement.
It is going long the trend line very well on the weekly chart too.
NUS (weekly)
EP = 48.84
ATR

$NUS - Oversold on Daily- Adding to watchlist for Tuesday morning.
- Just past earnings, which seemed good, but investors reacted to a change coming to CEO.
- Seems like it wants to test that volume shelf on the Daily as well.
- Oversold on RSI.
I red opening down to the volume shelf on Tuesday, and then a bounce to gr

NUS, Triangle Ascending (bullish)I found this pattern at tickeron website with the following data:
STATUS = Confirmed
CURRENT CONFIDENCE = 70%
TARGET (EXIT) PRICE = 52.67 USD
BREAKOUT (ENTRY) PRICE = 52.10 USD
DISTANCE TO TARGET PRICE = 0.65%
EMERGED ON = Nov 17, 10:00 AM (EST)
CONFIRMED ON = Nov 17, 11:02 AM (EST)
WITH CONFIDENCE

See all ideas
Trade directly on the supercharts through our supported, fully-verified and user-reviewed brokers.


Curated watchlists where NUS is featured.

Frequently Asked Questions
Depending on the exchange, the stock ticker may vary. For instance, on FWB exchange NU SKIN ENTERPRISES A stocks are traded under the ticker NUS.
NU SKIN ENTERPRISES A is going to release the next earnings report on May 8, 2024. Keep track of upcoming events with our Earnings Calendar.
One year price forecast for NU SKIN ENTERPRISES A has a max estimate of 15.8 EUR and a min estimate of 13.0 EUR.
NUS earnings for the last quarter are −0.70 EUR whereas the estimation was 0.61 EUR which accounts for −215.03% surprise. Estimated earnings for the next quarter are −0.02 EUR. See more details about NU SKIN ENTERPRISES A earnings.
NU SKIN ENTERPRISES A revenue for the last quarter amounts to 471.83 M EUR despite the estimated figure of 492.00 M EUR. In the next quarter revenue is expected to reach 431.61 M EUR.
Yes, you can track NU SKIN ENTERPRISES A financials in yearly and quarterly reports right on TradingView.
Like other stocks, NUS shares are traded on stock exchanges, e.g. Nasdaq, Nyse, Euronext, and the easiest way to buy them is through an online stock broker. To do this, you need to open an account and follow a broker's procedures, then start trading. You can trade NU SKIN ENTERPRISES A stock right from TradingView charts — choose your broker and connect to your account.
As of Apr 16, 2024, the company has 15.20 K employees. See our rating of the largest employees — is NU SKIN ENTERPRISES A on this list?
EBITDA measures a company's operating performance, its growth signifies an improvement in the efficiency of a company. NU SKIN ENTERPRISES A EBITDA is 166.99 M EUR, and current EBITDA margin is 6.99%. See more stats in NU SKIN ENTERPRISES A financial statements.