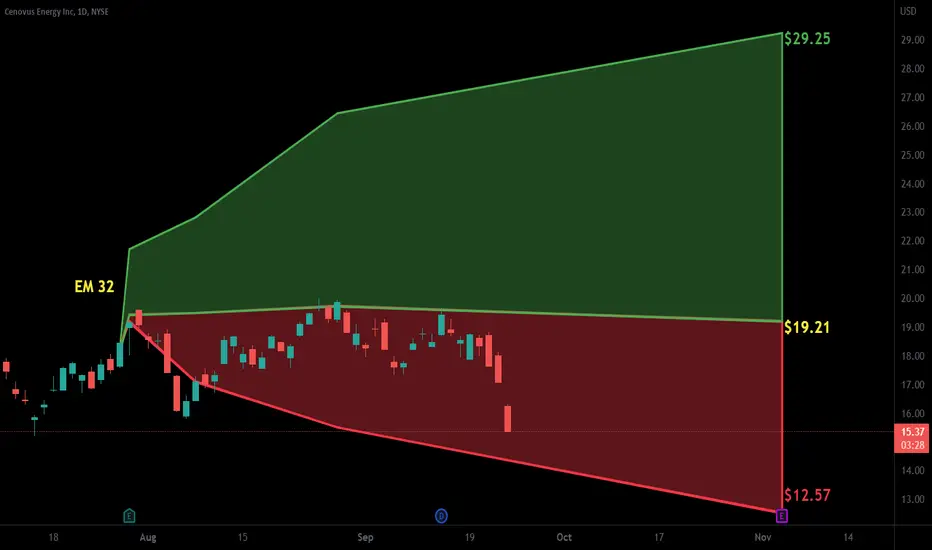
CVE shortChart analysis leads me to believe that shorting CVE is a good option here. I would definitely buy the dip at around 1.40 - 1.60 though. We'll see what happens.
1.470EUR
2.81 BEUR
35.69 BEUR
1.32 B
About CENOVUS ENERGY INC.
Sector
Industry
CEO
Jonathan M. McKenzie
Website
Headquarters
Calgary
Employees (FY)
6.93 K
Founded
1881
FIGI
BBG000PZPXY7
Cenovus Energy, Inc. is a Canadian-based integrated energy company, which engages in the provision of gas and oil. It operates through the following segments: Upstream, Downstream, and Corporate and Eliminations. The Upstream segment refers to operations of oil sands, conventional, and offshore. The Downstream segment operates the Canadian and U.S. refining. The Corporate and Eliminations segment includes the corporates costs for general and administrative. The company was founded in 1881 and is headquartered in Calgary, Canada.

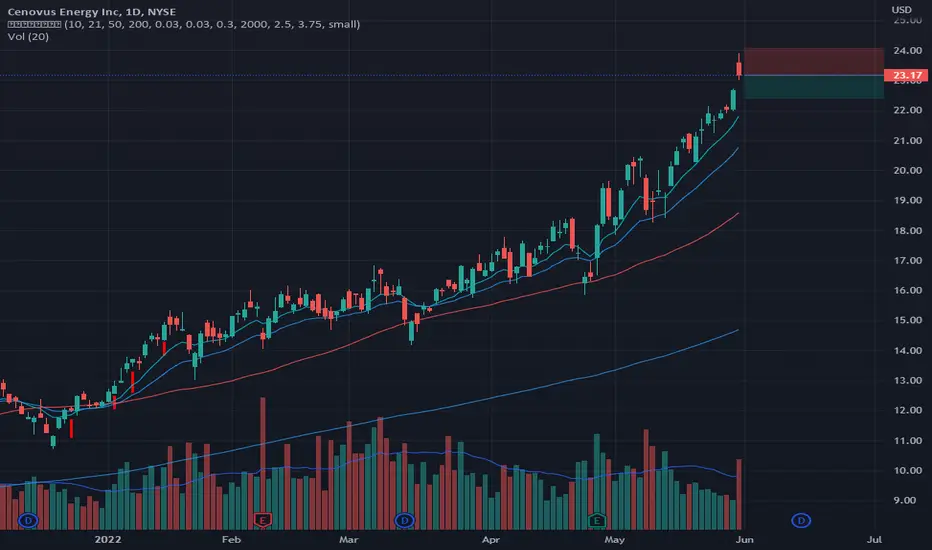
CVE BUYHi, according to my analysis. CVE stock. There is a very good buying opportunity as the stock has broken the downward trend. It also breached the sideways channel and the resistance at level 24. good luck for everbody

Cenovus Energy Inc. oilCVE stock on the 3Day time frame.
-Looks like a double top to me
-I am bearish to neutral on CVE
-48MA turning down, if the 13MA crosses also I'd be more bearish
-Highly dependant on Oil price but when main market sells off its a double wammy
None of this should be interpreted as financial advice

$CVE with a Bullish outlook following its earnings #Stocks The PEAD projected a Bullish outlook for $CVE after a Negative over reaction following its earnings release placing the stock in drift C with an expected accuracy of 100%.

Cenovus Energy INC.CVE price chart analysis on the 3Day time frame 2015-Current.
In line with my "Keep it simple stupid" philosophy, my trend analysis shows that when the 13 SMA crosses the 48 SMA, it is a notable occurrence, possibly indicating a change in trend upcoming. My buy or sell decision occurs when the red

$CVE with a Bullish outlook following its earnings #Stocks The PEAD projected a Bullish outlook for $CVE after a Positive Under reaction following its earnings release placing the stock in drift A with an expected accuracy of 70%.
Cenovus Energy Moving Back UpCenovus Energy has had a bit of a run after reporting higher Q2 EPS year over year.
They are also potentially getting a bit of a bump pre next weeks OPEC meeting with crude oil closing higher on Friday even as recession concerns continue as traders see little prospect of a rise in supply coming fr

US Stock In Play: $CVE$CVE - Energy | Oil & Gas Integrated
blow out quarter from ER yday, posting a record EPS of +0.92 (YoY +940%), and highest sales revenue of 12.95B (YoY +52%)
cleared AVWAP from ATH with imminent golden cross from short term MAs (10v20). a trajectory to resumption of its uptrend

Buy CVE in US stock market 26/7/2022You can buy it Target 18.75 and 20.59 stop loss 15.74 money management is your responsibility I recommend entering a maximum of 10% of the portfolio. good luck

CVE , Countertrend , SHORTThis looks like a trade to me , which I entered moments before close was actually looking at MRO as another choice but I like the way this one closed more from a risk to reward setup basis.
**** Countertrend ****, so low probability, but price action gives us some hints of a short term reversal mov
See all ideas
Trade directly on the supercharts through our supported, fully-verified and user-reviewed brokers.


Frequently Asked Questions
Depending on the exchange, the stock ticker may vary. For instance, on FWB exchange CENOVUS ENERGY INC. stocks are traded under the ticker CXD.
CENOVUS ENERGY INC. is going to release the next earnings report on Apr 24, 2024. Keep track of upcoming events with our Earnings Calendar.
CXD earnings for the last quarter are 0.68 EUR per share, whereas the estimation was 0.66 EUR resulting in a 2.29% surprise. The estimated earnings for the next quarter are 0.23 EUR per share. See more details about CENOVUS ENERGY INC. earnings.
CENOVUS ENERGY INC. revenue for the last quarter amounts to 12.05 B EUR despite the estimated figure of 11.66 B EUR. In the next quarter revenue is expected to reach 10.20 B EUR.
Yes, you can track CENOVUS ENERGY INC. financials in yearly and quarterly reports right on TradingView.
CXD net income for the last quarter is 507.90 M EUR, while the quarter before that showed 1.30 B EUR of net income which accounts for −60.87% change. Track more CENOVUS ENERGY INC. financial stats to get the full picture.
Yes, CXD dividends are paid quarterly. The last dividend per share was 0.10 EUR. As of today, Dividend Yield (TTM)% is 1.94%. Tracking CENOVUS ENERGY INC. dividends might help you take more informed decisions.
CENOVUS ENERGY INC. dividend yield was 2.38% in 2023, and payout ratio reached 24.43%. The year before the numbers were 1.33% and 10.65% correspondingly. See high-dividend stocks and find more opportunities for your portfolio.
Like other stocks, CXD shares are traded on stock exchanges, e.g. Nasdaq, Nyse, Euronext, and the easiest way to buy them is through an online stock broker. To do this, you need to open an account and follow a broker's procedures, then start trading. You can trade CENOVUS ENERGY INC. stock right from TradingView charts — choose your broker and connect to your account.
As of Apr 23, 2024, the company has 6.93 K employees. See our rating of the largest employees — is CENOVUS ENERGY INC. on this list?
We've gathered analysts' opinions on CENOVUS ENERGY INC. future price: according to them, CXD price has a max estimate of 25.93 EUR and a min estimate of 20.37 EUR. Read a more detailed CENOVUS ENERGY INC. forecast: see what analysts think of CENOVUS ENERGY INC. and suggest that you do with its stocks.
EBITDA measures a company's operating performance, its growth signifies an improvement in the efficiency of a company. CENOVUS ENERGY INC. EBITDA is 7.02 B EUR, and current EBITDA margin is 19.67%. See more stats in CENOVUS ENERGY INC. financial statements.