Randstad outlook Do you like my trade ideas?
For discount and transaction fee discounts please use my referrals
Binance
www.binance.com
Tradingview
www.tradingview.com
3.41EUR
624.00 MEUR
25.43 BEUR
101.47 M
About RANDSTAD N.V.
Sector
Industry
Headquarters
Diemen
Website
Employees (FY)
40 K
Founded
1989
ISIN
NL0000379121
FIGI
BBG000BFFZH1
Randstad NV engages in the provision of solutions in the fields of flexible work and human resources services. It operates through the following segments: North America, France, Netherlands, Italy, Germany, Belgium & Luxembourg, Iberia, Other European Countries, Rest of the World, Global Businesses, and Corporate. The company was founded by Frits Goldschmeding in 1960 and is headquartered in Diemen, the Netherlands.

Back to 42 for a long positionThe result are bad but the guidance are optimistic on EU and US for Q3, I think that a return to 42€ the 50% 'd be a buy signal for the first target break the 61.8%


Randstad Elliot wave - target 65CCI crossing -100 , RSI was oversold, elliot wave extension (1,6 wave 1) gives target of 65

Randstad completes test trendlineRandstad has succesfully tested the trendline from the tops in 2015 and 2017. The trendline acted as resistance at first, but became a support during the recent correction. Today, the earnings report is positively received by the market, so this provides a good entry for long positions.


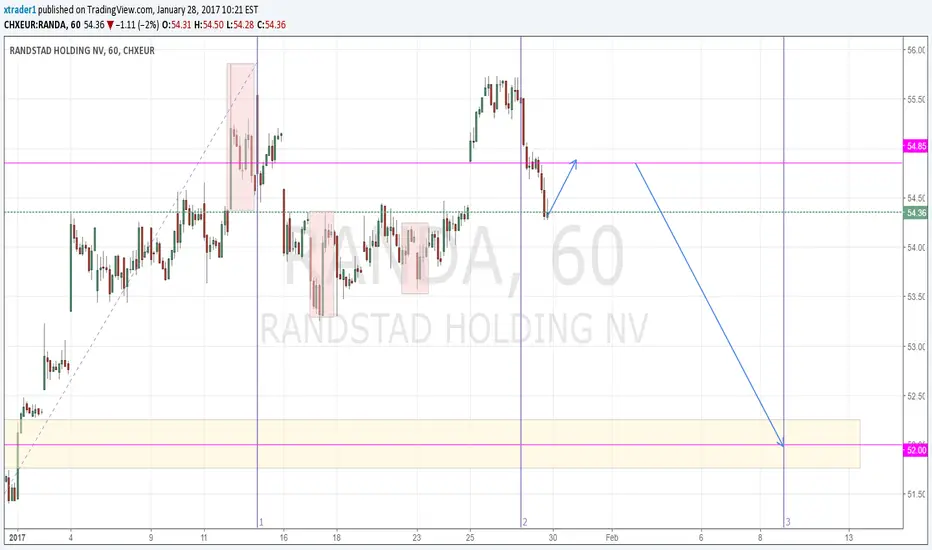
Update Forecast Randstad: limited move up to 54.85Price first dropped on monday. Still expect a limited move up before the drop.
Forecast Randstad for the coming weeks remains:
limited move up to 54.85, then move down to 52.00. Move down should be completed in the around Februar 9.
This update is a follow up on this chart:

Forecast Randstad: limited move up, then move down to 52.00Forecast Randstad for the coming weeks: limited move up to 54.85, then move down to 52.00. Move down should be completed in the around Februar 9.
See all ideas
Trade directly on the supercharts through our supported, fully-verified and user-reviewed brokers.


Curated watchlists where RAND is featured.

Frequently Asked Questions
The current price of RAND is 48.35 EUR — it has increased by 2.65% in the past 24 hours.
Depending on the exchange, the stock ticker may vary. For instance, on EURONEXT exchange RANDSTAD N.V. stocks are traded under the ticker RAND.
RANDSTAD N.V. is going to release the next earnings report on Apr 23, 2024. Keep track of upcoming events with our Earnings Calendar.
RAND stock is 3.44% volatile and has beta coefficient of 0.74. Check out the list of the most volatile stocks — is RANDSTAD N.V. there?
One year price forecast for RANDSTAD N.V. has a max estimate of 80.00 EUR and a min estimate of 38.00 EUR.
RAND earnings for the last quarter are 1.04 EUR whereas the estimation was 0.96 EUR which accounts for 8.57% surprise. Estimated earnings for the next quarter are 0.97 EUR. See more details about RANDSTAD N.V. earnings.
RANDSTAD N.V. revenue for the last quarter amounts to 6.26 B EUR despite the estimated figure of 6.37 B EUR. In the next quarter revenue is expected to reach 6.20 B EUR.
Yes, you can track RANDSTAD N.V. financials in yearly and quarterly reports right on TradingView.
RAND stock has fallen by 0.58% compared to the previous week, the month change is a 4.30% fall, over the last year RANDSTAD N.V. has showed a 9.15% decrease.
RAND net income for the last quarter is 163.00 M EUR, while the quarter before that showed 170.00 M EUR of net income which accounts for −4.12% change. Track more RANDSTAD N.V. financial stats to get the full picture.
Today RANDSTAD N.V. has the market capitalization of 8.38 B, it has increased by 1.48% over the last week.
RANDSTAD N.V. dividend yield was 6.26% in 2023, and payout ratio reached 102.81%. The year before the numbers were 5.00% and 56.57% correspondingly. See high-dividend stocks and find more opportunities for your portfolio.
Like other stocks, RAND shares are traded on stock exchanges, e.g. Nasdaq, Nyse, Euronext, and the easiest way to buy them is through an online stock broker. To do this, you need to open an account and follow a broker's procedures, then start trading. You can trade RANDSTAD N.V. stock right from TradingView charts — choose your broker and connect to your account.
As of Apr 19, 2024, the company has 40.00 K employees. See our rating of the largest employees — is RANDSTAD N.V. on this list?
Investing in stocks requires a comprehensive research: you should carefully study all the available data, e.g. company's financials, related news, and its technical analysis. So RANDSTAD N.V. technincal analysis shows the sell today, and its 1 week rating is sell. Since market conditions are prone to changes, it's worth looking a bit further into the future — according to the 1 month rating RANDSTAD N.V. stock shows the sell signal. See more of RANDSTAD N.V. technicals for a more comprehensive analysis.
If you're still not sure, try looking for inspiration in our curated watchlists.
If you're still not sure, try looking for inspiration in our curated watchlists.
We've gathered analysts' opinions on RANDSTAD N.V. future price: according to them, RAND price has a max estimate of 80.00 EUR and a min estimate of 38.00 EUR. Read a more detailed RANDSTAD N.V. forecast: see what analysts think of RANDSTAD N.V. and suggest that you do with its stocks.
EBITDA measures a company's operating performance, its growth signifies an improvement in the efficiency of a company. RANDSTAD N.V. EBITDA is 1.37 B EUR, and current EBITDA margin is 5.10%. See more stats in RANDSTAD N.V. financial statements.