CRVThis coin must be the most complex coin ever.
But I remain bullish with my bias to $50-$60 top wave 3 into late 2025

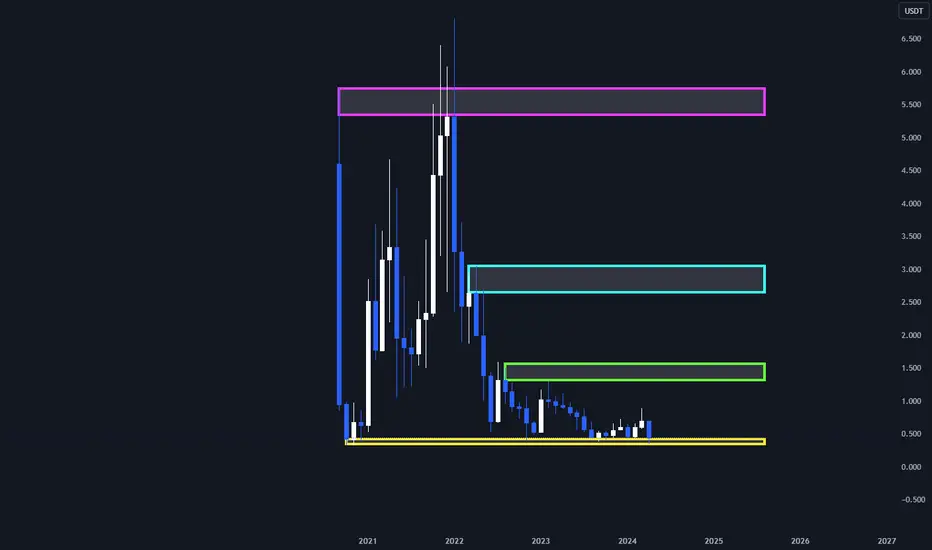
1200 % long opportunity on CRV Institutional lvls marked. Movement has been polarized with possible upwards movement/accummulation.
Currently testing the last pandora´s box before creating higher origin lvls.
Target 1: 1.300
Target 2: 2.600
Target 3 : 5.300
Good luck.
$CRV #Curve Trading IdeaCRV/USD (Curve) and other ALTs are still in a deep deep bear market. Perfect time to accumulate some more. My max. potential target point during the bull rally would be around $2.00.

🛑🔄"The Most Critical Support for CRV's Life" 💡📉💹 Let's dive into analyzing the favorite coin of Ethereum whales, CRV.
💰 Firstly, if you examine the wallets of CRV holders, you'll notice some crucial aspects. Most Ethereum holders also hold a significant amount of this coin in their wallets. We'll discuss this further after the analysis.
🔄 On t

Curve has a massive potential at this pointCRV is still in this downward sloping channel. At this point, I filled my bags, ready for a run into the first resistance zone of 1.9$.


Curve DAO (CRV)Curve Finance is an Automated Market Maker based Decentralized Exchange (DEX) that focuses on allowing users to swap between assets that have very similar underlying value at the lowest slippage.
Anyway, it seems CRV is oscillating in a wide sideways channel. Currently, CRV is at the bottom of thi

CRV - behind or ahead of the curve?If that count towards a new low plays out, I'd be looking at 52 cents and below.
Alternative count, similar short-term conclusion:
Alternative conclusion, that's significantly more bullish in the short-term:

CRV - Don't waste the opportunity! Howdy fellas!
What an opportunity on alts this evening!
Outstanding!
I hope some of you guys took advantage, because smart money buys here.
Trade thirsty, my friends!

CRVUSDTHi guys
This cryptocurrency is one of our watch list. If the long-term downward trend line is broken, we expect an upward trend similar to the scenario.
Buying or adding volume on these areas is very risky. The price areas of $0.6675 and $0.5517 are low-risk areas for buying.
What do you think?

See all ideas
Frequently Asked Questions
CRV / TetherUS (CRV) reached the lowest price of 0.3280 USDT on Oct 25, 2020.
See the list of crypto losers to find unexpected opportunities.
See the list of crypto losers to find unexpected opportunities.
Crypto markets are famous for their volatility, so one should study all the available stats before adding crypto assets to their portfolio. Very often it's technical analysis that comes in handy. We prepared technical ratings for CRV / TetherUS (CRV): today its technical analysis shows the sell signal, and according to the 1 week rating CRV shows the sell signal. And you'd better dig deeper and study 1 month rating too — it's sell. Find inspiration in CRV / TetherUS trading ideas and keep track of what's moving crypto markets with our crypto news feed.
CRV / TetherUS price has risen by 0.96% over the last week, its month performance shows a 39.30% decrease, and as for the last year, CRV / TetherUS has decreased by 54.34%.
Keep track of coins' changes with our Crypto heatmap.
Keep track of coins' changes with our Crypto heatmap.
CRV / TetherUS (CRV) reached its highest price on Aug 15, 2020 — it amounted to 23.2550 USDT.
See the list of crypto gainers and choose what best fits your strategy.
See the list of crypto gainers and choose what best fits your strategy.
CRV / TetherUS (CRV) is just as reliable as any other crypto asset — this corner of the world market is highly volatile. Today, for instance, CRV / TetherUS is estimated as 3.94% volatile. The only thing it means is that you must prepare and examine all available information before making a decision. And if you're not sure about CRV / TetherUS, you can find more inspiration in our curated watchlists.
You can discuss CRV / TetherUS (CRV) with other users in our public chats, Minds or in the comments to Ideas.
CRV / TetherUS highest price ever is 23.2550 USDT, and the maximum drawdown from this value it has ever experienced is 6.99 K%, when CRV / TetherUS reached 0.3280 USDT.
The safest choice when buying CRV is to go to a well-known crypto exchange. Some of the popular names are Binance, Coinbase, Kraken. But you'll have to find a reliable broker and create an account first. You can trade CRV right from TradingView charts — just choose a broker and connect to your account.