STYLAM INDUSTRIES LTD STYLAM INDUSTRIES LTD (1D)
CMP 1796.60
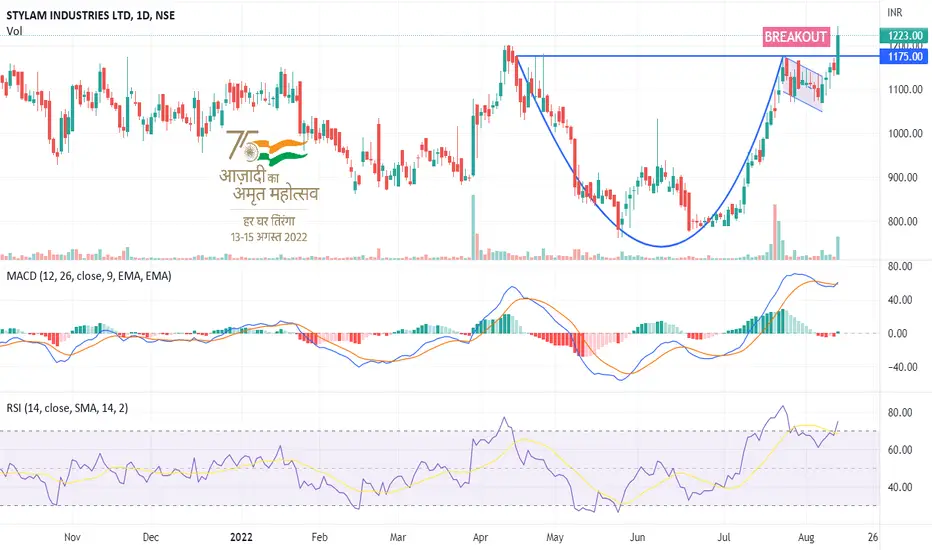
Stock price has made cup & handle pattern
Stock closed at All Time High
Sector : Construction & Material
Smallcap
Market cap : 3,051.41 cr
PE : 29.69
Industry PE : 38.69
FII has increased their holdings in last 2 Quarters
DII Continuously Increasing St
69.40INR
959.80 MINR
9.52 BINR
6.20 M
About STYLAM INDUSTRIES LIMITED
Sector
Industry
CEO
Jagdish Rai Gupta
Website
Headquarters
Chandigarh
Founded
1991
ISIN
INE239C01020
FIGI
BBG000F5LKZ5
Stylam Industries Ltd. engages in the manufacturing of laminates, solid surface panels, and allied products. Its products include hpl, performance laminates, specialty laminates, exclusive surfaces, acrylic solid surface, and compact laminates. The company was founded by Nathu Ram Aggarwal and Jagdish Rai Gupta on October 28, 1991 and is headquartered in Chandigarh, India.

STYLAMIND BREAKOUTIf this stock sustains 1650 then 200-2300 is possible in short to medium term, stock currently trading at the PE of26.62, market cap 2736cr roe 30%

STYLAMIND - CUP & HANDLE BREAKOUT 📊 Script: STYLAMIND (STYLAM INDUSTRIES LIMITED)
📊 Nifty50 Stock: NO
📊 Sectoral Index: NA
📊 Sector: Consumer Durables
📊 Industry: Plywood Boards/ Laminate
Key highlights: 💡⚡
📈 Script is trading at upper band of BB.
📈 MACD is giving crossover.
📈 Already Crossover in Double Moving Averages.
📈 Right n
See all ideas
Trade directly on the supercharts through our supported, fully-verified and user-reviewed brokers.


Frequently Asked Questions
The current price of STYLAMIND is 1654.15 INR — it has increased by 1.18% in the past 24 hours.
Depending on the exchange, the stock ticker may vary. For instance, on BSE exchange STYLAM INDUSTRIES LIMITED stocks are traded under the ticker STYLAMIND.
STYLAM INDUSTRIES LIMITED is going to release the next earnings report on May 28, 2024. Keep track of upcoming events with our Earnings Calendar.
STYLAMIND stock is 3.94% volatile and has beta coefficient of 0.23. Check out the list of the most volatile stocks — is STYLAM INDUSTRIES LIMITED there?
One year price forecast for STYLAM INDUSTRIES LIMITED has a max estimate of 2550.00 INR and a min estimate of 1655.00 INR.
STYLAMIND earnings for the last quarter are 15.80 INR per share, whereas the estimation was 15.31 INR resulting in a 3.20% surprise. The estimated earnings for the next quarter are 16.71 INR per share. See more details about STYLAM INDUSTRIES LIMITED earnings.
STYLAM INDUSTRIES LIMITED revenue for the last quarter amounts to 2.34 B INR despite the estimated figure of 2.37 B INR. In the next quarter revenue is expected to reach 2.24 B INR.
Yes, you can track STYLAM INDUSTRIES LIMITED financials in yearly and quarterly reports right on TradingView.
STYLAMIND stock has fallen by 2.99% compared to the previous week, the month change is a 4.76% rise, over the last year STYLAM INDUSTRIES LIMITED has showed a 47.96% increase.
STYLAMIND net income for the last quarter is 313.35 M INR, while the quarter before that showed 317.52 M INR of net income which accounts for −1.31% change. Track more STYLAM INDUSTRIES LIMITED financial stats to get the full picture.
Today STYLAM INDUSTRIES LIMITED has the market capitalization of 27.71 B, it has increased by 4.43% over the last week.
STYLAM INDUSTRIES LIMITED dividend yield was 0% in 2022, and payout ratio reached 0%. The year before the numbers were 0.24% and 6.93% correspondingly. See high-dividend stocks and find more opportunities for your portfolio.
Like other stocks, STYLAMIND shares are traded on stock exchanges, e.g. Nasdaq, Nyse, Euronext, and the easiest way to buy them is through an online stock broker. To do this, you need to open an account and follow a broker's procedures, then start trading. You can trade STYLAM INDUSTRIES LIMITED stock right from TradingView charts — choose your broker and connect to your account.
Investing in stocks requires a comprehensive research: you should carefully study all the available data, e.g. company's financials, related news, and its technical analysis. So STYLAM INDUSTRIES LIMITED technincal analysis shows the buy rating today, and its 1 week rating is buy. Since market conditions are prone to changes, it's worth looking a bit further into the future — according to the 1 month rating STYLAM INDUSTRIES LIMITED stock shows the buy signal. See more of STYLAM INDUSTRIES LIMITED technicals for a more comprehensive analysis.
If you're still not sure, try looking for inspiration in our curated watchlists.
If you're still not sure, try looking for inspiration in our curated watchlists.
We've gathered analysts' opinions on STYLAM INDUSTRIES LIMITED future price: according to them, STYLAMIND price has a max estimate of 2550.00 INR and a min estimate of 1655.00 INR. Read a more detailed STYLAM INDUSTRIES LIMITED forecast: see what analysts think of STYLAM INDUSTRIES LIMITED and suggest that you do with its stocks.
EBITDA measures a company's operating performance, its growth signifies an improvement in the efficiency of a company. STYLAM INDUSTRIES LIMITED EBITDA is 1.77 B INR, and current EBITDA margin is 16.40%. See more stats in STYLAM INDUSTRIES LIMITED financial statements.