StertoolsStock name = Sterling Tools Limited.
Weekly chart setup
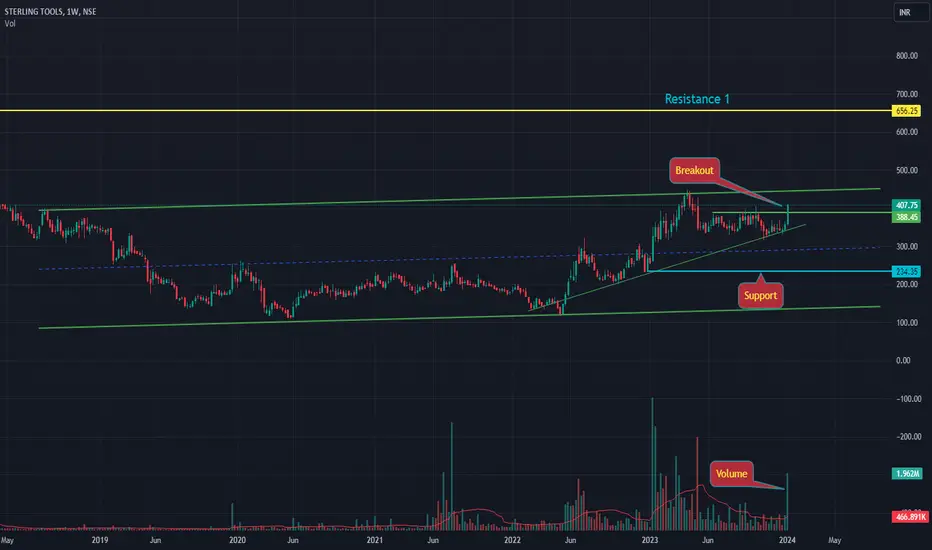
Chart is self explanatory. Levels of breakout, possible up-moves (where stock may find resistances) and support (close below which, setup will be invalidated) are clearly defined.
Disclaimer: This is for demonstration and educational purpose o
13.00INR
478.78 MINR
7.70 BINR
8.84 M
About STERLING TOOLS LTD.
Sector
Industry
CEO
Anil Aggarwal
Website
Headquarters
Faridabad
Employees (FY)
1.5 K
Founded
1979
ISIN
INE334A01023
FIGI
BBG000FFL8V4
Sterling Tools Ltd. engages in the manufacture and sale of automotive products. It offers cold forged high tensile fasteners, bolts, nuts, screws, and washers of iron and steel for the automobile, general engineering, consumer durables, railways, and auto replacement industries. The company was founded on June 7, 1979 and is headquartered in Faridabad, India.
Necklace Pattern Series - "Sterling Tools"Classic Necklace Pattern along with "W" i.e. double bottom formation at lower levels on M TF.
Check your own chart, this is only for educational purpose & Not a buy recommendation.

Sterling Tools Ltd #Long Setup
🔹 Stock Trading above 50 & 200 EMA
🔹 Stock making Big Base with higher volume
🔹 Stock structure is Uptrend
🔹 Breakout Level 390 Support 360
🔹 RR Favorable for going long
♻️ Retweet for max reach.
#StockMarket #stocks #StocksToBuy #stockstowatch

sterling toolThe company has reported total income of Rs. 208.4574 crores during the period ended December 31, 2022 as compared to Rs. 179.1285 crores during the period ended September 30, 2022.
The company has posted net profit / (loss) of Rs. 13.9173 crores for the period ended December 31, 2022 as against ne

One stock from the new leader sector
Sterling tools made a cup and handle pattern
It is from industrials sector
Industrials are making new high
Keep a watch on this sector

STERLING TOOLS Rounding pattern The sterling tools daily chart rounding pattern formation, this is not perfect rounding patter, but this is the rounding pattern this is change in the movementum, i am bullish this share but current level no trade is the best.

Long setup sterling toolsStock at Strong support with reversal May go to 300 plus. Stop loss 183.
Disclaimer: The stock/index/currency discussed do not constitute Investment/trading advise and is merely an effort towards enhancing learning, knowledge and book keeping. Kindly do your own due diligence and/or consult investme

Sterling tools near its supply zoneStertools has been on a downtrend since 2018.
The stock has made a double bottom and currently at the neck line which is very strong supply zone of 250rs-260rs which coincides with 38.2% fib level.
If the stock manages to give a weekly closing above 250rs and sustains the same in the following week,

STERLING TOOLS STERTOOLS NSE BULLISHVIEW ABOVE 288 CMP 293STERLING TOOLS STERTOOLS NSE is bullish if 288 holds. Near 52 weeks High. Positive Trend. Fresh Breakout.
Disclaimer: Educational purpose only. Not Buy/Sell reco. Not SEBi Registered.


See all ideas
Trade directly on the supercharts through our supported, fully-verified and user-reviewed brokers.


Frequently Asked Questions
The current price of STERTOOLS is 360.00 INR — it has decreased by 1.49% in the past 24 hours.
Depending on the exchange, the stock ticker may vary. For instance, on BSE exchange STERLING TOOLS LTD. stocks are traded under the ticker STERTOOLS.
STERLING TOOLS LTD. is going to release the next earnings report on May 23, 2024. Keep track of upcoming events with our Earnings Calendar.
STERTOOLS stock is 2.30% volatile and has beta coefficient of 0.23. Check out the list of the most volatile stocks — is STERLING TOOLS LTD. there?
One year price forecast for STERLING TOOLS LTD. has a max estimate of 420.00 INR and a min estimate of 420.00 INR.
STERTOOLS earnings for the last quarter are 3.30 INR whereas the estimation was 3.90 INR which accounts for −15.38% surprise. Estimated earnings for the next quarter are 3.90 INR. See more details about STERLING TOOLS LTD. earnings.
STERLING TOOLS LTD. revenue for the last quarter amounts to 2.10 B INR despite the estimated figure of 2.29 B INR. In the next quarter revenue is expected to reach 2.22 B INR.
Yes, you can track STERLING TOOLS LTD. financials in yearly and quarterly reports right on TradingView.
STERTOOLS stock has risen by 5.22% compared to the previous week, the month change is a 12.15% rise, over the last year STERLING TOOLS LTD. has showed a 10.67% decrease.
STERTOOLS net income for the last quarter is 135.84 M INR, while the quarter before that showed 124.63 M INR of net income which accounts for 8.99% change. Track more STERLING TOOLS LTD. financial stats to get the full picture.
Today STERLING TOOLS LTD. has the market capitalization of 12.13 B, it has increased by 1.66% over the last week.
Yes, STERTOOLS dividends are paid annually. The last dividend per share was 2.00 INR. As of today, Dividend Yield (TTM)% is 0.59%. Tracking STERLING TOOLS LTD. dividends might help you take more informed decisions.
STERLING TOOLS LTD. dividend yield was 0.50% in 2022, and payout ratio reached 15.05%. The year before the numbers were 0.74% and 14.11% correspondingly. See high-dividend stocks and find more opportunities for your portfolio.
Like other stocks, STERTOOLS shares are traded on stock exchanges, e.g. Nasdaq, Nyse, Euronext, and the easiest way to buy them is through an online stock broker. To do this, you need to open an account and follow a broker's procedures, then start trading. You can trade STERLING TOOLS LTD. stock right from TradingView charts — choose your broker and connect to your account.
As of Apr 19, 2024, the company has 1.50 K employees. See our rating of the largest employees — is STERLING TOOLS LTD. on this list?
Investing in stocks requires a comprehensive research: you should carefully study all the available data, e.g. company's financials, related news, and its technical analysis. So STERLING TOOLS LTD. technincal analysis shows the buy rating today, and its 1 week rating is buy. Since market conditions are prone to changes, it's worth looking a bit further into the future — according to the 1 month rating STERLING TOOLS LTD. stock shows the buy signal. See more of STERLING TOOLS LTD. technicals for a more comprehensive analysis.
If you're still not sure, try looking for inspiration in our curated watchlists.
If you're still not sure, try looking for inspiration in our curated watchlists.
We've gathered analysts' opinions on STERLING TOOLS LTD. future price: according to them, STERTOOLS price has a max estimate of 420.00 INR and a min estimate of 420.00 INR. Read a more detailed STERLING TOOLS LTD. forecast: see what analysts think of STERLING TOOLS LTD. and suggest that you do with its stocks.
EBITDA measures a company's operating performance, its growth signifies an improvement in the efficiency of a company. STERLING TOOLS LTD. EBITDA is 993.31 M INR, and current EBITDA margin is 12.63%. See more stats in STERLING TOOLS LTD. financial statements.