ROSSEL INDIA LTD BREAKOUT ROSSEL INDIA LTD BREAKOUT
Buy for swing trading rossel india
Target for 550 to 600
For Everyday Updates follow me.
3.50INR
276.49 MINR
3.49 BINR
8.49 M
About ROSSELL INDIA LTD.
Sector
Industry
CEO
Harsh Mohan Gupta
Website
Headquarters
New Delhi
Employees (FY)
7.57 K
Founded
1994
ISIN
INE847C01020
FIGI
BBG000QGZFZ5
Rossell India Ltd. engages in tea, aviation, and hospitality services businesses. It operates through the following segments: Cultivation, Manufacture and Sale of and Sale of Tea segment includeTea; Aviation Products and Services; and Hospitality. The Cultivation, Manufacture s the tea estates in Assam. The Aviation Products and Services segment is involved in the engineering and manufacturing in aerospace and defense. The Hospitality segment operates quick service restaurants under the brand name Kebab Xpress. The company was founded on June 10, 1994 and is headquartered in New Delhi, India.

Resistance Breakout - ROSSELLINDIAPlease look into the chart for a detailed understanding.
Consider these for short-term & swing trades with 2% profit.
For BTST trades consider booking
target for 1% - 2%
For long-term trades look out for resistance drawn above closing.
Please consider these ideas for educational purpose
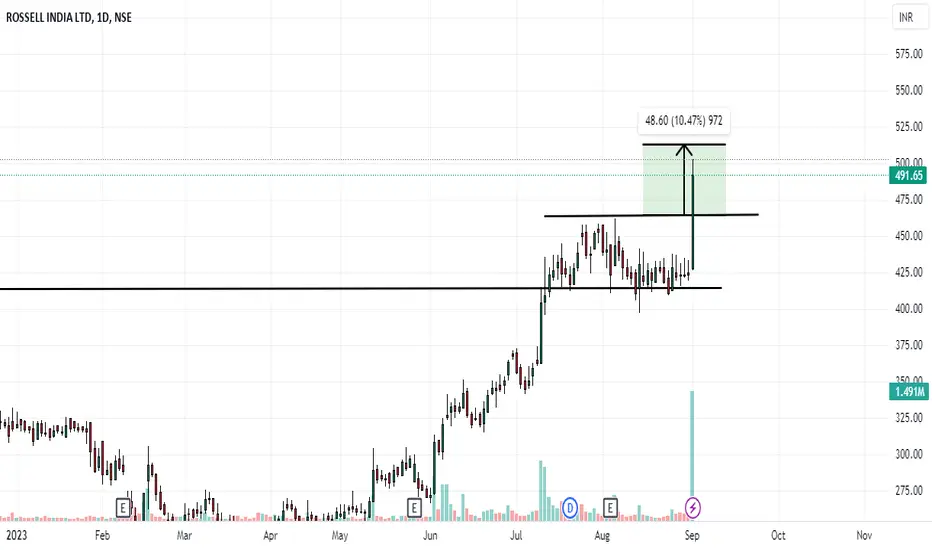
Huge volumeLevel 440 and 460 broken
Good break out given after break out
508 traget
See Consolidation observe

ROSSELLIND NSE BULLISH VIEW ABOVE 212 CMP 222ROSSELLIND NSE is bullish if 212 holds. Near Lifetime High. Fresh Breakout. Positive Trend.
Disclaimer: Educational Purpose Only. Not Buy Sell Reco . Not Sebi Registered.


ROSSELL A BUY?THE COMPANY HAS BEEN PERFORMING WELL FUNDAMENTALLY AND HAS INCREASES SALES BY 15% YOY ALONG WITH A 25% INCREASE IN PROFIT YOY.
AFTER STRONG FUNDAMENTALS THE TECHNICAL COMES INTO PLAY.
A BREAKOUT ABOVE ATH WILL LEAD TO OUR FIRST CONSERVATIVE TARGET OF 225 LEVELS FOLLOWED BY FIB EXTENSION LEVELS OF 26


Keep Rossell India on Radar. Keep an eye on Rossell India. Can be bought only after closing above 94 with Strict SL of 87 for 150 in 3-4 Months.

See all ideas
Trade directly on the supercharts through our supported, fully-verified and user-reviewed brokers.


Frequently Asked Questions
The current price of ROSSELLIND is 401.30 INR — it has increased by 2.33% in the past 24 hours.
Depending on the exchange, the stock ticker may vary. For instance, on BSE exchange ROSSELL INDIA LTD. stocks are traded under the ticker ROSSELLIND.
ROSSELLIND stock is 5.05% volatile and has beta coefficient of 1.18. Check out the list of the most volatile stocks — is ROSSELL INDIA LTD. there?
Yes, you can track ROSSELL INDIA LTD. financials in yearly and quarterly reports right on TradingView.
ROSSELLIND stock has fallen by 1.88% compared to the previous week, the month change is a 9.42% rise, over the last year ROSSELL INDIA LTD. has showed a 61.16% increase.
ROSSELLIND net income for the last quarter is 19.60 M INR, while the quarter before that showed 243.70 M INR of net income which accounts for −91.96% change. Track more ROSSELL INDIA LTD. financial stats to get the full picture.
Today ROSSELL INDIA LTD. has the market capitalization of 14.78 B, it has increased by 3.98% over the last week.
Yes, ROSSELLIND dividends are paid annually. The last dividend per share was 0.40 INR. As of today, Dividend Yield (TTM)% is 0.10%. Tracking ROSSELL INDIA LTD. dividends might help you take more informed decisions.
ROSSELL INDIA LTD. dividend yield was 0.17% in 2022, and payout ratio reached 5.35%. The year before the numbers were 0.15% and 3.67% correspondingly. See high-dividend stocks and find more opportunities for your portfolio.
Like other stocks, ROSSELLIND shares are traded on stock exchanges, e.g. Nasdaq, Nyse, Euronext, and the easiest way to buy them is through an online stock broker. To do this, you need to open an account and follow a broker's procedures, then start trading. You can trade ROSSELL INDIA LTD. stock right from TradingView charts — choose your broker and connect to your account.
As of Apr 18, 2024, the company has 7.57 K employees. See our rating of the largest employees — is ROSSELL INDIA LTD. on this list?
Investing in stocks requires a comprehensive research: you should carefully study all the available data, e.g. company's financials, related news, and its technical analysis. So ROSSELL INDIA LTD. technincal analysis shows the neutral today, and its 1 week rating is sell. Since market conditions are prone to changes, it's worth looking a bit further into the future — according to the 1 month rating ROSSELL INDIA LTD. stock shows the buy signal. See more of ROSSELL INDIA LTD. technicals for a more comprehensive analysis.
If you're still not sure, try looking for inspiration in our curated watchlists.
If you're still not sure, try looking for inspiration in our curated watchlists.
EBITDA measures a company's operating performance, its growth signifies an improvement in the efficiency of a company. ROSSELL INDIA LTD. EBITDA is 378.20 M INR, and current EBITDA margin is 14.04%. See more stats in ROSSELL INDIA LTD. financial statements.