Rane holidingNSE:RANEHOLDIN
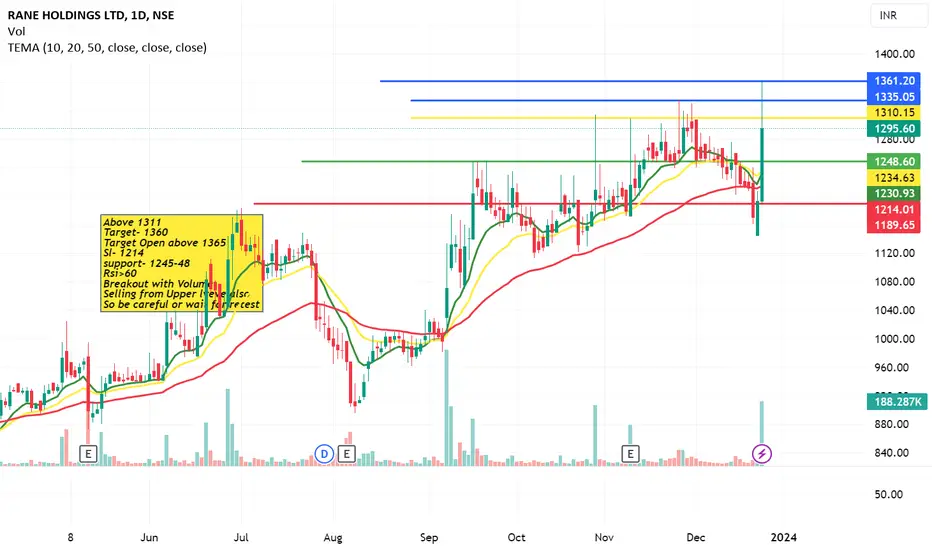
Above 1311
Target- 1360
Target Open above 1365
Sl- 1214
support- 1245-48
Rsi>60
Breakout with Volume
Selling from Upper lveve also
So be careful or wait for retest
51.50INR
622.70 MINR
34.95 BINR
5.97 M
About RANE HOLDINGS LTD.
Sector
Industry
Headquarters
Chennai
Website
Employees (FY)
182
Founded
1929
ISIN
INE384A01010
FIGI
BBG000CYHX73
Rane Holdings Ltd. engages in the manufacture and marketing of automotive components for the transportation industry. It operates through the India and Rest of the World geographical segments. The firm's products include Steering and Suspension systems, friction materials, valve train components, occupant safety systems, light metal casting, after-market products, and provides telematics solutions. The company was founded in 1929 and is headquartered in Chennai, India.
Rane Holding LTD For PositionalLooks good for long term (duration few Months)
Refer the levels in the chart for more info.

Rane Holdings20/08/2023
Rane Holdings on Monthly Chart
CMP:1002.95
Target :1185-1400-1600
SL:820
Information is only for study purpose


Rane Holdings-Nice breakout.Rane Holdings-Nice breakout.
Capital to be deployed- 20k
Investing Price -1135-40
Breakout Price -1133
Stoploss-1017
Targets-1587/2042
#raneholdings #nifty50 #NiftyBank #investment #StockMarket #StocksToBuy

Triangle Pattern BreakoutPlease look into the chart for a detailed understanding.
Consider these for short-term & swing trades with 2% profit.
For BTST trades consider booking
target for 1% - 2%
For long-term trades look out for resistance drawn above closing.
Please consider these ideas for educational purpose

RANEHOLDIN- Weekly AnalysisIn the Weekly Chart of RANEHOLDIN ,
we can see that; it has given a breakout.
Also it has given closing above 1000.
Let it retest and the Enter with SL.
Go Long till above target.

RANEHOLDIN- Weekly AnalysisIn the Weekly Chart of RANEHOLDIN,
we can see that, its is getting multiple rejections at 975.
its has good % of target.
Plan asper your risk ratio.


Rane Holding | Swing Trade Idea 1)Price is moving in the triangle pattern in Daily Pattern.
2)And in the Lower timeframe we can see an Expanding channel.
3)Once the price gives a breakout to the Expanding
channel we can enter keeping the stoploss below the 600 levels.
4)By entering at this level we can wait for the breakout of

See all ideas
Trade directly on the supercharts through our supported, fully-verified and user-reviewed brokers.


Frequently Asked Questions
The current price of RANEHOLDIN is 1244.65 INR — it has decreased by 1.48% in the past 24 hours.
Depending on the exchange, the stock ticker may vary. For instance, on BSE exchange RANE HOLDINGS LTD. stocks are traded under the ticker RANEHOLDIN.
RANE HOLDINGS LTD. is going to release the next earnings report on May 15, 2024. Keep track of upcoming events with our Earnings Calendar.
RANEHOLDIN stock is 5.05% volatile and has beta coefficient of 0.39. Check out the list of the most volatile stocks — is RANE HOLDINGS LTD. there?
Yes, you can track RANE HOLDINGS LTD. financials in yearly and quarterly reports right on TradingView.
RANEHOLDIN stock has risen by 5.48% compared to the previous week, the month change is a 17.41% rise, over the last year RANE HOLDINGS LTD. has showed a 34.55% increase.
RANEHOLDIN net income for the last quarter is 389.60 M INR, while the quarter before that showed 406.40 M INR of net income which accounts for −4.13% change. Track more RANE HOLDINGS LTD. financial stats to get the full picture.
Today RANE HOLDINGS LTD. has the market capitalization of 18.04 B, it has increased by 0.46% over the last week.
Yes, RANEHOLDIN dividends are paid annually. The last dividend per share was 17.00 INR. As of today, Dividend Yield (TTM)% is 1.35%. Tracking RANE HOLDINGS LTD. dividends might help you take more informed decisions.
RANE HOLDINGS LTD. dividend yield was 1.97% in 2022, and payout ratio reached 38.98%. The year before the numbers were 2.04% and 70.97% correspondingly. See high-dividend stocks and find more opportunities for your portfolio.
Like other stocks, RANEHOLDIN shares are traded on stock exchanges, e.g. Nasdaq, Nyse, Euronext, and the easiest way to buy them is through an online stock broker. To do this, you need to open an account and follow a broker's procedures, then start trading. You can trade RANE HOLDINGS LTD. stock right from TradingView charts — choose your broker and connect to your account.
As of Apr 23, 2024, the company has 182.00 employees. See our rating of the largest employees — is RANE HOLDINGS LTD. on this list?
Investing in stocks requires a comprehensive research: you should carefully study all the available data, e.g. company's financials, related news, and its technical analysis. So RANE HOLDINGS LTD. technincal analysis shows the buy rating today, and its 1 week rating is strong buy. Since market conditions are prone to changes, it's worth looking a bit further into the future — according to the 1 month rating RANE HOLDINGS LTD. stock shows the strong buy signal. See more of RANE HOLDINGS LTD. technicals for a more comprehensive analysis.
If you're still not sure, try looking for inspiration in our curated watchlists.
If you're still not sure, try looking for inspiration in our curated watchlists.
EBITDA measures a company's operating performance, its growth signifies an improvement in the efficiency of a company. RANE HOLDINGS LTD. EBITDA is 3.40 B INR, and current EBITDA margin is 8.96%. See more stats in RANE HOLDINGS LTD. financial statements.