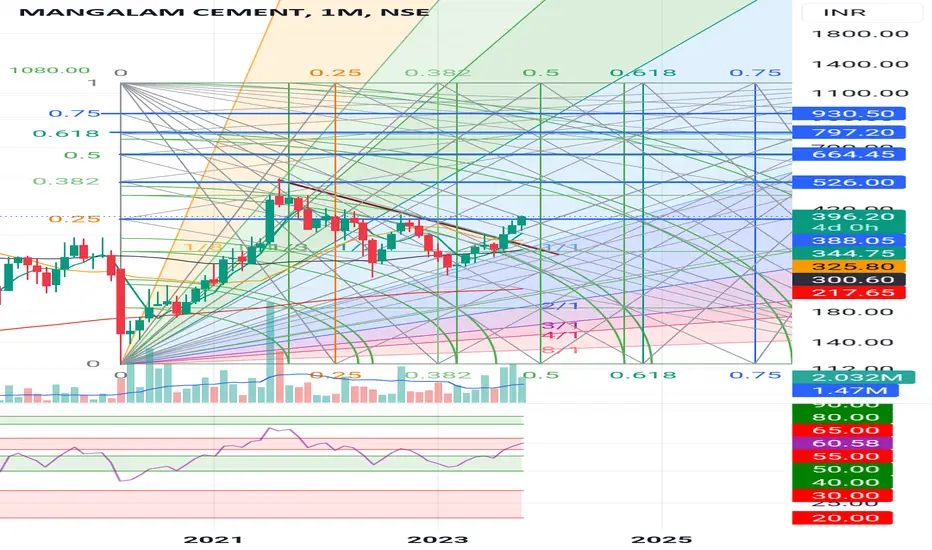
acceding Channel pattern 17 Years acceding Channel pattern Breakout. Risk 10% & Reward leave where can go grab as much possible.
21.10INR
171.23 MINR
17.92 BINR
10.40 M
About MANGALAM CEMENT LTD.
Sector
Industry
Headquarters
Kolkata
Website
Employees (FY)
2.89 K
Founded
1976
ISIN
INE347A01017
FIGI
BBG000CW51C4
Mangalam Cement Ltd. engages in the manufacture and sale of cement. Its products include Portland Pozzolana cement, and 43 and 53 grade cement. It operates under the Birla Uttam Cement brand. The company was founded by Basant Kumar Birla on October 27, 1976 and is headquartered in Kolkata, India.

MANGALAM CEM Chart for studytell me which pattern form
DARWOX theory
or
DOW theory
and tomorrow which side will move

In-Depth Analysis of MANGLMCEM (NSE: MANGLMCEM)Technical Overview:
1. RSI Divergence and Weekly Chart Support:
MANGLMCEM's weekly chart indicates significant support at the Relative Strength Index (RSI) divergence. RSI is a momentum oscillator, and divergence can signal potential reversals or shifts in the prevailing trend. The presence of

MANGALAMCEMENT DAILY CHARTMangalacement has given a swing breakout.
Cmp 319.65 Target 377 Breakout 301

💥Mangalam Cements💥-Nice Breakout💥Mangalam Cements💥-Nice Breakout
Capital to be deployed- 20k
Investing Price -405-410
Breakout Price-400
Stoploss-333
Targets-530-670-934
RT for max reach
#mangalamcements #StocksToBuy #stocks #StocksToTrade #StocksInFocus #stockstowatch #StocksInNews

Swing trading ideaMANGALAM CEMENT did weekly resistance breakout with huge volume which was created with huge gap up we can play this as swing trade for the target of 30% to 35 % with the SL of 8%.

Mangalam CementsLooking really good after breaking out one of the important Gann levels and huge volumes being seen for the last few months
Follow the levels marked on the chart for the SL and the targets
Cup and Handle Breakout for Mangalam Cement looks like.Mangalam Cement is a B.K. Birla Group company, producing cement in various grades using the dry process and marketing under the brand name of "Birla Uttam". Mangalam Cement CMP is 332.20.
The negative aspects of the company are high valuation (P.E. = 53.3) and declining cash from operations. Posit

Reversal VisibleThis counter can move up to 335 in the next few weeks. One should track this counter for knowledge purposes. At attractive valuations and reverse zones on technical charts.

Buy if breakout happens with good volumeThis can be a good short term trade above 394 if breaks with good vol. Target 423,467.Good Luck :)

See all ideas
Trade directly on the supercharts through our supported, fully-verified and user-reviewed brokers.


Frequently Asked Questions
The current price of MANGLMCEM is 856.25 INR — it has increased by 0.43% in the past 24 hours.
Depending on the exchange, the stock ticker may vary. For instance, on BSE exchange MANGALAM CEMENT LTD. stocks are traded under the ticker MANGLMCEM.
MANGALAM CEMENT LTD. is going to release the next earnings report on May 16, 2024. Keep track of upcoming events with our Earnings Calendar.
MANGLMCEM stock is 4.82% volatile and has beta coefficient of 1.01. Check out the list of the most volatile stocks — is MANGALAM CEMENT LTD. there?
MANGLMCEM earnings for the last quarter are 4.40 INR per share, whereas the estimation was 7.10 INR resulting in a −38.03% surprise. The estimated earnings for the next quarter are 9.80 INR per share. See more details about MANGALAM CEMENT LTD. earnings.
MANGALAM CEMENT LTD. revenue for the last quarter amounts to 4.28 B INR despite the estimated figure of 4.24 B INR. In the next quarter revenue is expected to reach 4.38 B INR.
Yes, you can track MANGALAM CEMENT LTD. financials in yearly and quarterly reports right on TradingView.
MANGLMCEM stock has risen by 3.34% compared to the previous week, the month change is a 34.94% rise, over the last year MANGALAM CEMENT LTD. has showed a 199.39% increase.
MANGLMCEM net income for the last quarter is 159.54 M INR, while the quarter before that showed 117.90 M INR of net income which accounts for 35.32% change. Track more MANGALAM CEMENT LTD. financial stats to get the full picture.
Today MANGALAM CEMENT LTD. has the market capitalization of 23.44 B, it has increased by 2.12% over the last week.
Yes, MANGLMCEM dividends are paid annually. The last dividend per share was 1.50 INR. As of today, Dividend Yield (TTM)% is 0.18%. Tracking MANGALAM CEMENT LTD. dividends might help you take more informed decisions.
MANGALAM CEMENT LTD. dividend yield was 0.57% in 2022, and payout ratio reached 24.09%. The year before the numbers were 0.39% and 5.31% correspondingly. See high-dividend stocks and find more opportunities for your portfolio.
Like other stocks, MANGLMCEM shares are traded on stock exchanges, e.g. Nasdaq, Nyse, Euronext, and the easiest way to buy them is through an online stock broker. To do this, you need to open an account and follow a broker's procedures, then start trading. You can trade MANGALAM CEMENT LTD. stock right from TradingView charts — choose your broker and connect to your account.
As of Apr 19, 2024, the company has 2.89 K employees. See our rating of the largest employees — is MANGALAM CEMENT LTD. on this list?
Investing in stocks requires a comprehensive research: you should carefully study all the available data, e.g. company's financials, related news, and its technical analysis. So MANGALAM CEMENT LTD. technincal analysis shows the buy rating today, and its 1 week rating is strong buy. Since market conditions are prone to changes, it's worth looking a bit further into the future — according to the 1 month rating MANGALAM CEMENT LTD. stock shows the strong buy signal. See more of MANGALAM CEMENT LTD. technicals for a more comprehensive analysis.
If you're still not sure, try looking for inspiration in our curated watchlists.
If you're still not sure, try looking for inspiration in our curated watchlists.
EBITDA measures a company's operating performance, its growth signifies an improvement in the efficiency of a company. MANGALAM CEMENT LTD. EBITDA is 2.02 B INR, and current EBITDA margin is 7.08%. See more stats in MANGALAM CEMENT LTD. financial statements.