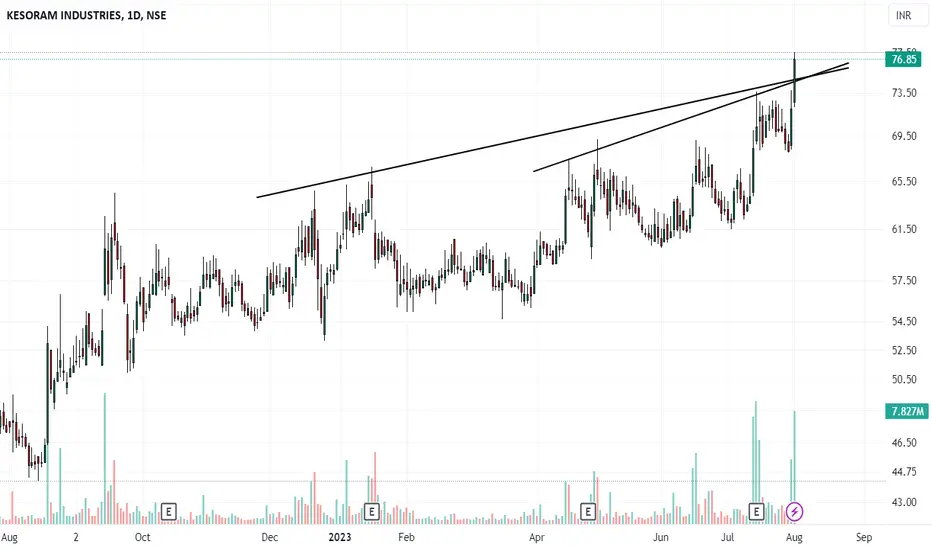
Channel breakout on KESORAMINDKESORAMIND broke out of channel pattern on daily chart. There has been tight consolidation for almost three months. Trading in the range of 10-15%. Also during runup to the channel, there were huge buying as shown in volume. While consolidating you could notice volume has dried up. Signifies sellers
−5.35INR
−1.94 BINR
37.78 BINR
132.93 M
About KESORAM INDUSTRIES LTD.
Sector
Industry
CEO
Padmalochanan Radhakrishnan
Website
Headquarters
Kolkata
Employees (FY)
4.83 K
Founded
1919
ISIN
INE087A01019
FIGI
BBG000CV5939
Kesoram Industries Ltd. engages in the manufacture and sale of cement. The company operates under the India and Others geographical segments. The company was founded on October 18, 1919 and is headquartered in Kolkata, India.

Kesoramind Looking for 200 Big Breakout in Kesoramind verysoon i will be 200 . now moving above the 200 EMA.
also strong fundamental available .

Kesoram Ind - Long ideaI am betting on increased cement demand post monsoon season. Chart pattern is also good, potential to touch 120+ in mid term. Levels are marked on chart. Invest with 6-9 months time horizon.

KESORAM INDUSTRUIES LOOKS GOOD FROM HERENSE:KESORAMIND
KESORAMIND Swing Breakout
R:R (Risk : Reward) = 1:3
TARGET 1 - 114
FINAL TARGET - 130

Trendline BreakoutPlease look into the chart for a detailed understanding.
Consider these for short-term & swing trades with 2% profit.
For BTST trades consider booking
target for 1% - 2%
For long-term trades look out for resistance drawn above closing.
Please consider these ideas for educational purpose
KESORAM TRIANGLE PATTERN swing trade take trade when nifty turns bullish swing trade perfect symmetrical triangle short term opportunity for upside take trade after breakout from the trendline according to own risk this is not call just a analysis.


Kesaram India Sun Storm Investment Trading Desk & NexGen Wealth Management Service Present's: SSITD & NexGen Portfolio of the Week Series
Focus: Worldwide
By Sun Storm Investment Research & NexGen Wealth Management Service
A Profit & Solutions Strategy & Research
Trading | Investment | Stocks | ETF | Mutua
Postional Trade ideaafter long consolidation price move upward now RSI showing the strength,Price Action Strong, good for 2-3 months, Happy trading.


See all ideas
Trade directly on the supercharts through our supported, fully-verified and user-reviewed brokers.


Frequently Asked Questions
The current price of KESORAMIND is 171.85 INR — it has increased by 0.38% in the past 24 hours.
Depending on the exchange, the stock ticker may vary. For instance, on BSE exchange KESORAM INDUSTRIES LTD. stocks are traded under the ticker KESORAMIND.
KESORAM INDUSTRIES LTD. is going to release the next earnings report on May 10, 2024. Keep track of upcoming events with our Earnings Calendar.
KESORAMIND stock is 2.34% volatile and has beta coefficient of 1.64. Check out the list of the most volatile stocks — is KESORAM INDUSTRIES LTD. there?
Yes, you can track KESORAM INDUSTRIES LTD. financials in yearly and quarterly reports right on TradingView.
KESORAMIND stock has risen by 1.63% compared to the previous week, the month change is a 2.94% rise, over the last year KESORAM INDUSTRIES LTD. has showed a 165.49% increase.
KESORAMIND net income for the last quarter is −488.60 M INR, while the quarter before that showed −583.70 M INR of net income which accounts for 16.29% change. Track more KESORAM INDUSTRIES LTD. financial stats to get the full picture.
Today KESORAM INDUSTRIES LTD. has the market capitalization of 53.18 B, it has decreased by 0.85% over the last week.
No, KESORAMIND doesn't pay any dividends to its shareholders. But don't worry, we've prepared a list of high-dividend stocks for you.
Like other stocks, KESORAMIND shares are traded on stock exchanges, e.g. Nasdaq, Nyse, Euronext, and the easiest way to buy them is through an online stock broker. To do this, you need to open an account and follow a broker's procedures, then start trading. You can trade KESORAM INDUSTRIES LTD. stock right from TradingView charts — choose your broker and connect to your account.
As of Apr 23, 2024, the company has 4.83 K employees. See our rating of the largest employees — is KESORAM INDUSTRIES LTD. on this list?
Investing in stocks requires a comprehensive research: you should carefully study all the available data, e.g. company's financials, related news, and its technical analysis. So KESORAM INDUSTRIES LTD. technincal analysis shows the buy rating today, and its 1 week rating is buy. Since market conditions are prone to changes, it's worth looking a bit further into the future — according to the 1 month rating KESORAM INDUSTRIES LTD. stock shows the buy signal. See more of KESORAM INDUSTRIES LTD. technicals for a more comprehensive analysis.
If you're still not sure, try looking for inspiration in our curated watchlists.
If you're still not sure, try looking for inspiration in our curated watchlists.
EBITDA measures a company's operating performance, its growth signifies an improvement in the efficiency of a company. KESORAM INDUSTRIES LTD. EBITDA is 3.84 B INR, and current EBITDA margin is 7.21%. See more stats in KESORAM INDUSTRIES LTD. financial statements.