Kellton Tech Solutions LtdKellton Tech Solutions Ltd offers services in digital transformation, ERP and other IT services. It has operations across US, Europe, India and Asia-Pacific with a team of ~1,500 employees
Services Offered
The company offers a wide range of services through different platforms to help its clients fo
−14.13INR
−1.27 BINR
9.17 BINR
45.92 M
About KELLTON TECH SOLUTIONS LTD.
Sector
Industry
CEO
Krishna Chintam Reddy
Website
Headquarters
Hyderabad
Employees (FY)
1.21 K
Founded
1993
ISIN
INE164B01022
FIGI
BBG000F3PLD8
Kellton Tech Solutions Ltd. engages in the provision of information technology solutions.The firm operates through the following segments: Digital Transformation, Enterprise Solutions, and Consulting. Its products and platforms include kellton4media, klgame, optima, and thrive. The company was founded by Niranjan Reddy Chintam on December 31, 1993 and is headquartered in Hyderabad, India.

Kellton techenter positionally with minimum 100 and then add dips of 20 pts.... Open sky above 150. Enter only positional and no short term view.

Kellton Tech Solutions LtdInformation technology solutions are offered by Kellton Tech Solutions Ltd. Digital Transformation, Enterprise Solutions, and Consulting are the three divisions through which the company conducts business.
Hello, friends
AI (Artificial Intelligence) is a reality today. I looked at a few AI-related b

Kellton Tech Solutions LtdTarget in charts and SL @75
FUNDAMENTALS
Market Cap
₹ 851 Cr.
Current Price
₹ 88.2
Stock P/E
15.8
Book Value
₹ 38.6
Dividend Yield
0.00 %
ROCE
14.5 %
ROE
10.4 %
Face Value
₹ 5.00
Promoter holding
52.1 %
EPS last year
₹ -13.1
EPS latest quarter
₹ 1.60
Debt
₹ 148 Cr.
Pledged percentag

KELTON Long PostitionalBuy KELTON above 106
Target of 117-128-140-146
SL 74
Strategy : SBO + RSI > 60 + EMA above 20 & 50
Duration few weeks
Please consult your financial advisor before investing
All research for educational purposes only.
Stock is ready to cross past barriers with good volumes

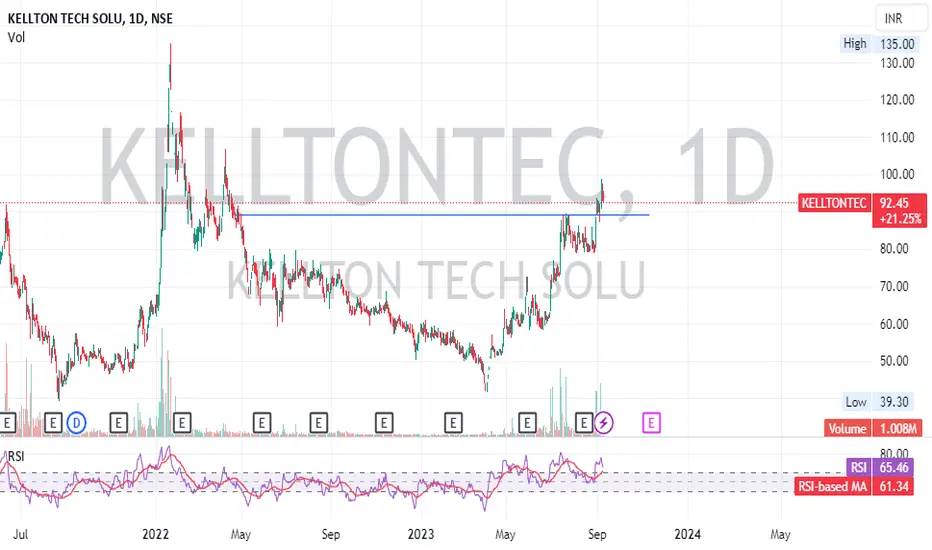
KelltontecStock name = Kellton Tech Solutions Limited.
Daily chart setup
Chart is self explanatory. Levels of breakout, possible up-moves (where stock may find resistances) and support (close below which, setup will be invalidated) are clearly defined.
Disclaimer: This is for demonstration and educational pu

Kellton techKellton tech formed cup with handle pattern targets market it gave breakout and retested let's see what happens

KELLTONTECH BreakoutRSI Rising from bottom
Recent volumes are good.
Breakout again.
Target 1-89
Target 2-94

Kellton TechAlmost nearing 2 year breakout and fundamentally good low PE Stock as well.
Looking good on all the timeframes.
SL below weekly 200 SMA

kellton tech C&H patternKellton Tech Solutions Ltd offers services in digital transformation, ERP and other IT services. It has operations across US, Europe, India and Asia-Pacific with a team of ~1,500 employees
See all ideas
Trade directly on the supercharts through our supported, fully-verified and user-reviewed brokers.


Frequently Asked Questions
The current price of KELLTONTEC is 98.39 INR — it has decreased by 0.28% in the past 24 hours.
Depending on the exchange, the stock ticker may vary. For instance, on BSE exchange KELLTON TECH SOLUTIONS LTD. stocks are traded under the ticker KELLTONTEC.
KELLTON TECH SOLUTIONS LTD. is going to release the next earnings report on May 28, 2024. Keep track of upcoming events with our Earnings Calendar.
KELLTONTEC stock is 2.91% volatile and has beta coefficient of 1.98. Check out the list of the most volatile stocks — is KELLTON TECH SOLUTIONS LTD. there?
Yes, you can track KELLTON TECH SOLUTIONS LTD. financials in yearly and quarterly reports right on TradingView.
KELLTONTEC stock has fallen by 3.53% compared to the previous week, the month change is a 1.41% fall, over the last year KELLTON TECH SOLUTIONS LTD. has showed a 87.59% increase.
KELLTONTEC net income for the last quarter is 81.29 M INR, while the quarter before that showed 165.30 M INR of net income which accounts for −50.82% change. Track more KELLTON TECH SOLUTIONS LTD. financial stats to get the full picture.
Today KELLTON TECH SOLUTIONS LTD. has the market capitalization of 9.61 B, it has decreased by 0.19% over the last week.
Like other stocks, KELLTONTEC shares are traded on stock exchanges, e.g. Nasdaq, Nyse, Euronext, and the easiest way to buy them is through an online stock broker. To do this, you need to open an account and follow a broker's procedures, then start trading. You can trade KELLTON TECH SOLUTIONS LTD. stock right from TradingView charts — choose your broker and connect to your account.
As of Apr 19, 2024, the company has 1.21 K employees. See our rating of the largest employees — is KELLTON TECH SOLUTIONS LTD. on this list?
Investing in stocks requires a comprehensive research: you should carefully study all the available data, e.g. company's financials, related news, and its technical analysis. So KELLTON TECH SOLUTIONS LTD. technincal analysis shows the sell today, and its 1 week rating is neutral. Since market conditions are prone to changes, it's worth looking a bit further into the future — according to the 1 month rating KELLTON TECH SOLUTIONS LTD. stock shows the buy signal. See more of KELLTON TECH SOLUTIONS LTD. technicals for a more comprehensive analysis.
If you're still not sure, try looking for inspiration in our curated watchlists.
If you're still not sure, try looking for inspiration in our curated watchlists.
EBITDA measures a company's operating performance, its growth signifies an improvement in the efficiency of a company. KELLTON TECH SOLUTIONS LTD. EBITDA is 889.80 M INR, and current EBITDA margin is 10.37%. See more stats in KELLTON TECH SOLUTIONS LTD. financial statements.