Trade Idea in GOLDIAM
Swing Trade in NSE:GOLDIAM
CMP 191
TP 227
SL 165
Goldiam International Ltd. is a holding company, which engages in the manufacture and export of diamond studded gold and silver jewelry products. It operates through the Jewellery Manufacturing Activity and Investment Activity segments. The com
8.30INR
844.25 MINR
5.33 BINR
35.29 M
About GOLDIAM INTERNATIONAL LTD.
Sector
Industry
CEO
Anmol Rashesh Bhansali
Website
Headquarters
Mumbai
Employees (FY)
225
Founded
1986
ISIN
INE025B01025
FIGI
BBG000C08DV4
Goldiam International Ltd. is a holding company, which engages in the manufacture and export of diamond studded gold and silver jewelry products. It operates through the Jewellery Manufacturing Activity and Investment Activity segments. The company was founded on October 10, 1986 and is headquartered in Mumbai, India.

GOLDIAM - Could be a gold mine in the Mid Term :-)An Investment pick, for target of 372,50% + ROI, after the all time high of 272 is taken off.
The stock is strong in all higher time frames. Showing Fibonacci 61% retracement in Monthly, moving strong to take off the Swing High at 272.
Volumes and Price action confirmation in weekly.
One may ac

Goldiam international ltd Expecting a volume spurt till end of the day and a good momentum for a intraday trade
Swing trade on a closing above 206
Sl 183
Tgt 224 250 280
Rr of 1:1
Ask your financial advisor before buying only for educational purposes

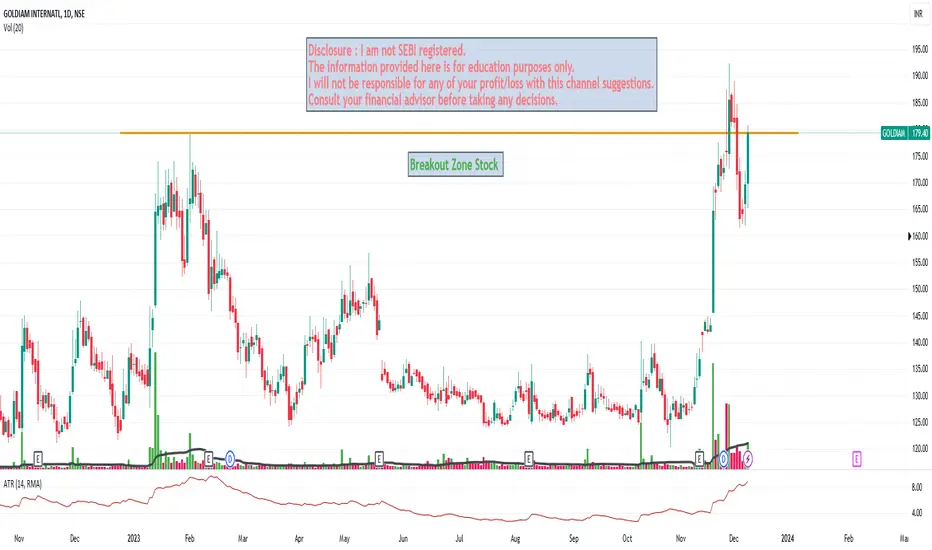
Goldiam International Ltd. Breakout Zone Buy Above 185 With SLGoldiam International Ltd.
Buy Above Not Before 185
Stop Loss : 160
Target : 210-235
Holding Time : 1-2 Month
Disclosure : I am not SEBI registered.The information provided here is for education purposes only.I will not be responsible for any of your profit/loss with this channel suggest
Goldiam - Bullish Flag PatternA must buy portfolio stock for long term investment.
Goldiam CMP - 183
Buy At Current Price 183
Target 1 - 200
Target 2 - 250
Target 3 - 300
Disclaimer: This is my view and for educational purpose only. Trade according to your risk and am not responsible for your loss.

Goldiam International Goldiam International
giving desending triangle breakout with
volumn in weekly chart
CMP - 168
Short term tgt 180/210++
Stop Loss around 120


GOLDIAM INTERNATIONAL looks good NSE:GOLDIAM Levels for SWING
Wizard Levels/Zones
>Hey buddy, Wait for the price to close above or below-mentioned zones. Once the price closes above or below, SUPPORT becomes RESISTANCE and RESISTANCE becomes SUPPORT.
> If you're following these zones then kindly follow the rules too. Risk ma


📈 Exciting Bullish Pattern Alert! 🐂📊 Pattern: Symmetric Triangle
📌 Symbol/Asset: Goldiam International
🔍 Description: Stock at pattern's strong support
👉 Remember: Technical patterns are just one piece of the puzzle. Consider conducting further research, consulting with a financial advisor, and managing your risks appropriately.

See all ideas
Trade directly on the supercharts through our supported, fully-verified and user-reviewed brokers.


Frequently Asked Questions
The current price of GOLDIAM is 170.50 INR — it has decreased by 0.61% in the past 24 hours.
Depending on the exchange, the stock ticker may vary. For instance, on BSE exchange GOLDIAM INTERNATIONAL LTD. stocks are traded under the ticker GOLDIAM.
GOLDIAM INTERNATIONAL LTD. is going to release the next earnings report on May 29, 2024. Keep track of upcoming events with our Earnings Calendar.
GOLDIAM stock is 3.29% volatile and has beta coefficient of 0.31. Check out the list of the most volatile stocks — is GOLDIAM INTERNATIONAL LTD. there?
One year price forecast for GOLDIAM INTERNATIONAL LTD. has a max estimate of 237.00 INR and a min estimate of 237.00 INR.
Yes, you can track GOLDIAM INTERNATIONAL LTD. financials in yearly and quarterly reports right on TradingView.
GOLDIAM stock has fallen by 6.93% compared to the previous week, the month change is a 0.44% fall, over the last year GOLDIAM INTERNATIONAL LTD. has showed a 18.73% increase.
GOLDIAM net income for the last quarter is 324.64 M INR, while the quarter before that showed 233.85 M INR of net income which accounts for 38.82% change. Track more GOLDIAM INTERNATIONAL LTD. financial stats to get the full picture.
Today GOLDIAM INTERNATIONAL LTD. has the market capitalization of 18.32 B, it has increased by 1.69% over the last week.
GOLDIAM INTERNATIONAL LTD. dividend yield was 1.56% in 2022, and payout ratio reached 25.82%. The year before the numbers were 0.79% and 12.58% correspondingly. See high-dividend stocks and find more opportunities for your portfolio.
Like other stocks, GOLDIAM shares are traded on stock exchanges, e.g. Nasdaq, Nyse, Euronext, and the easiest way to buy them is through an online stock broker. To do this, you need to open an account and follow a broker's procedures, then start trading. You can trade GOLDIAM INTERNATIONAL LTD. stock right from TradingView charts — choose your broker and connect to your account.
As of Apr 19, 2024, the company has 225.00 employees. See our rating of the largest employees — is GOLDIAM INTERNATIONAL LTD. on this list?
Investing in stocks requires a comprehensive research: you should carefully study all the available data, e.g. company's financials, related news, and its technical analysis. So GOLDIAM INTERNATIONAL LTD. technincal analysis shows the sell today, and its 1 week rating is neutral. Since market conditions are prone to changes, it's worth looking a bit further into the future — according to the 1 month rating GOLDIAM INTERNATIONAL LTD. stock shows the buy signal. See more of GOLDIAM INTERNATIONAL LTD. technicals for a more comprehensive analysis.
If you're still not sure, try looking for inspiration in our curated watchlists.
If you're still not sure, try looking for inspiration in our curated watchlists.
We've gathered analysts' opinions on GOLDIAM INTERNATIONAL LTD. future price: according to them, GOLDIAM price has a max estimate of 237.00 INR and a min estimate of 237.00 INR. Read a more detailed GOLDIAM INTERNATIONAL LTD. forecast: see what analysts think of GOLDIAM INTERNATIONAL LTD. and suggest that you do with its stocks.
EBITDA measures a company's operating performance, its growth signifies an improvement in the efficiency of a company. GOLDIAM INTERNATIONAL LTD. EBITDA is 1.13 B INR, and current EBITDA margin is 19.96%. See more stats in GOLDIAM INTERNATIONAL LTD. financial statements.