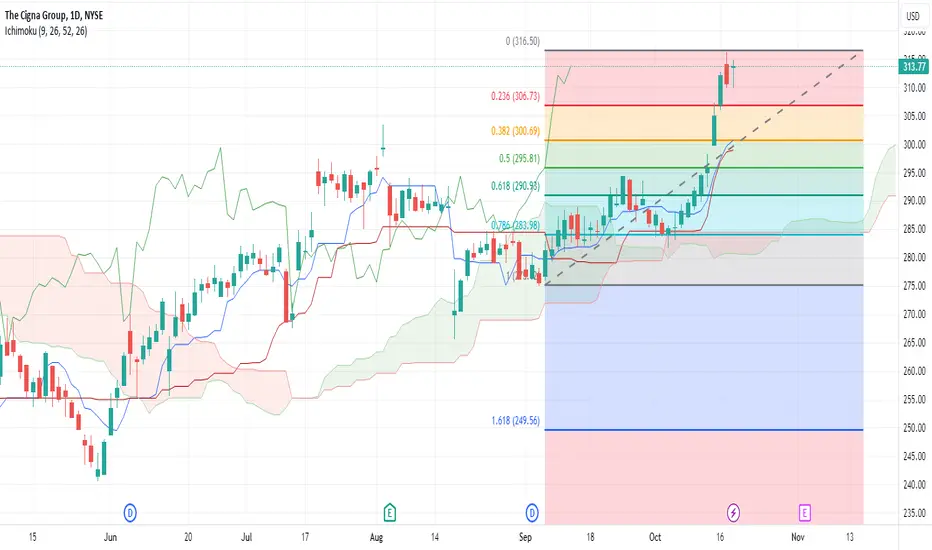
Box on $CIThe hourly chart is set to move higher if the bullish crossover will be confirmed.
Bullish Alert already popped out and price action already made its move
298.06MXN
87.71 BMXN
3.32 TMXN
278.49 M
About THE CIGNA GROUP
Sector
Industry
CEO
David Michael Cordani
Website
Headquarters
Bloomfield
Employees (FY)
72.5 K
Founded
1792
ISIN
US1255231003
FIGI
BBG00MXMTX39
The Cigna Group is a global health company, which engages in the provision of global health services. It operates through the following segments: Evernorth Health Services, Cigna Healthcare, Other Operations, and Corporate. The Evernorth Health Services segment partners with health plans, employers, governmental organizations, and health care providers to solve challenges in the areas of pharmacy benefits, home delivery pharmacy, specialty pharmacy, specialty distribution, and care delivery and management solutions. The Cigna Healthcare segment includes the U.S. Healthcare and International Health operating segments, which provide comprehensive medical and coordinated solutions to clients and customers. The Other Operations segment consists of the remainder of business operations, which includes certain ongoing businesses and exited businesses. The Corporate segment refers to net interest expense, certain litigation matters, expense associated with frozen pension plans, charitable contributions, operating severance, certain overhead and enterprise-wide project costs, and eliminations for products and services sold between segments. The company was founded in 1792 and is headquartered in Bloomfield, CT.

Cigna Squeezes After Sharp RallyCigna isn’t usually a very interesting stock. However, it jumped last week and some traders may see the potential for more upside.
The first pattern on today’s chart is the bullish gap on December 11 after the health insurer cancelled its planned merger with NYSE:HUM Humana. (Management will inst

Cigna Bull CaseI like using classic patterns. I like to keep things simple. I used to throw a million indicators on a chart and thought it was helping. But now I do not. I may use RSI, MACD, or a Delta Volume lower study. Other than that I only ever use a couple of moving averages, maybe VWAP on the chart above. B

Bat and Crab on CIBearish Bat on CI
You can ride the journey on CD as the final leg of the bearish bat pattern completes.
TP1: 88.6 % of XA when the bearish bat pattern is complete.
If trend turns bearish at that point, CI can be shorted all the way down to 38.2% of AD and then to 61.8% of AD.
If the uptrend con

CI short positionCI looks bullish. The price remains in the channel.
We're expecting the price to reach the upsloping resistance line and will come back to retests the upsloping support.
Our strategy is to entry short when it occurs.
Invalidation of this thesis would be if the price closes above the upsloping res

OverboughtLike many shares today the stock is overbought and a correction is long due. Yesterday we've seen a desperate attempt to reach the February high again. But neither this nor the January low could be reached again. The bulls have run out of velocity immediately. The upper range of the Donchian Channe
$CI with a bullish outlook following its earnings #StocksThe PEAD projected a bullish outlook for NYSE:CI after a positive under reaction following its earnings release placing the stock in drift A with an expected accuracy of 77.78%.


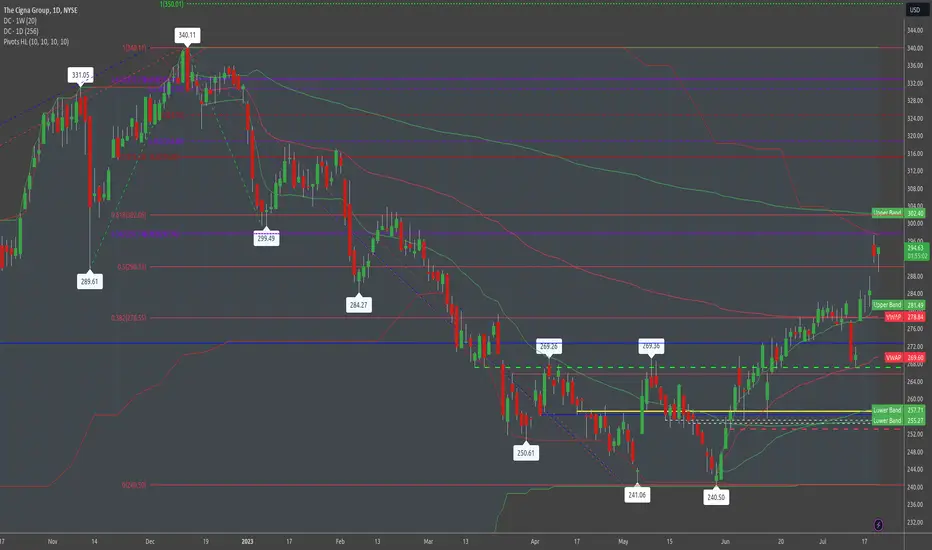
CIGNA Stock Chart Fibonacci Analysis 060823 Trading Idea
1) Find a FIBO slingshot
2) Check FIBO 61.80% level
3) Entry Point > 253/61.80%
Chart time frame : C
A) 15 min(1W-3M)
B) 1 hr(3M-6M)
C) 4 hr(6M-1year)
D) 1 day(1-3years)
Stock progress : A
A) Keep rising over 61.80% resistance
B) 61.80% resistance
C) Hit the bottom
D) Hit the top

See all ideas
Trade directly on the supercharts through our supported, fully-verified and user-reviewed brokers.


Curated watchlists where CI is featured.


Frequently Asked Questions
The current price of CI is 5929.00 MXN — it has increased by 19.54% in the past 24 hours.
Depending on the exchange, the stock ticker may vary. For instance, on BMV exchange THE CIGNA GROUP stocks are traded under the ticker CI.
THE CIGNA GROUP is going to release the next earnings report on May 2, 2024. Keep track of upcoming events with our Earnings Calendar.
CI stock is 16.34% volatile and has beta coefficient of 0.36. Check out the list of the most volatile stocks — is THE CIGNA GROUP there?
One year price forecast for THE CIGNA GROUP has a max estimate of 7331.85 MXN and a min estimate of 5906.21 MXN.
CI earnings for the last quarter are 118.01 MXN per share, whereas the estimation was 116.44 MXN resulting in a 1.35% surprise. The estimated earnings for the next quarter are 111.04 MXN per share. See more details about THE CIGNA GROUP earnings.
THE CIGNA GROUP revenue for the last quarter amounts to 855.46 B MXN despite the estimated figure of 839.20 B MXN. In the next quarter revenue is expected to reach 830.69 B MXN.
Yes, you can track THE CIGNA GROUP financials in yearly and quarterly reports right on TradingView.
CI net income for the last quarter is 17.48 B MXN, while the quarter before that showed 24.54 B MXN of net income which accounts for −28.79% change. Track more THE CIGNA GROUP financial stats to get the full picture.
Today THE CIGNA GROUP has the market capitalization of 1.69 T, it has decreased by 0.26% over the last week.
Yes, CI dividends are paid quarterly. The last dividend per share was 23.74 MXN. As of today, Dividend Yield (TTM)% is 1.46%. Tracking THE CIGNA GROUP dividends might help you take more informed decisions.
THE CIGNA GROUP dividend yield was 1.64% in 2023, and payout ratio reached 28.29%. The year before the numbers were 1.35% and 20.92% correspondingly. See high-dividend stocks and find more opportunities for your portfolio.
Like other stocks, CI shares are traded on stock exchanges, e.g. Nasdaq, Nyse, Euronext, and the easiest way to buy them is through an online stock broker. To do this, you need to open an account and follow a broker's procedures, then start trading. You can trade THE CIGNA GROUP stock right from TradingView charts — choose your broker and connect to your account.
As of Apr 19, 2024, the company has 72.50 K employees. See our rating of the largest employees — is THE CIGNA GROUP on this list?
Investing in stocks requires a comprehensive research: you should carefully study all the available data, e.g. company's financials, related news, and its technical analysis. So THE CIGNA GROUP technincal analysis shows the strong buy rating today, and its 1 week rating is strong buy. Since market conditions are prone to changes, it's worth looking a bit further into the future — according to the 1 month rating THE CIGNA GROUP stock shows the buy signal. See more of THE CIGNA GROUP technicals for a more comprehensive analysis.
If you're still not sure, try looking for inspiration in our curated watchlists.
If you're still not sure, try looking for inspiration in our curated watchlists.
We've gathered analysts' opinions on THE CIGNA GROUP future price: according to them, CI price has a max estimate of 7331.85 MXN and a min estimate of 5906.21 MXN. Read a more detailed THE CIGNA GROUP forecast: see what analysts think of THE CIGNA GROUP and suggest that you do with its stocks.