GOW @ 14 OCT 2021Text me if you have any questions/comments for me.
-----
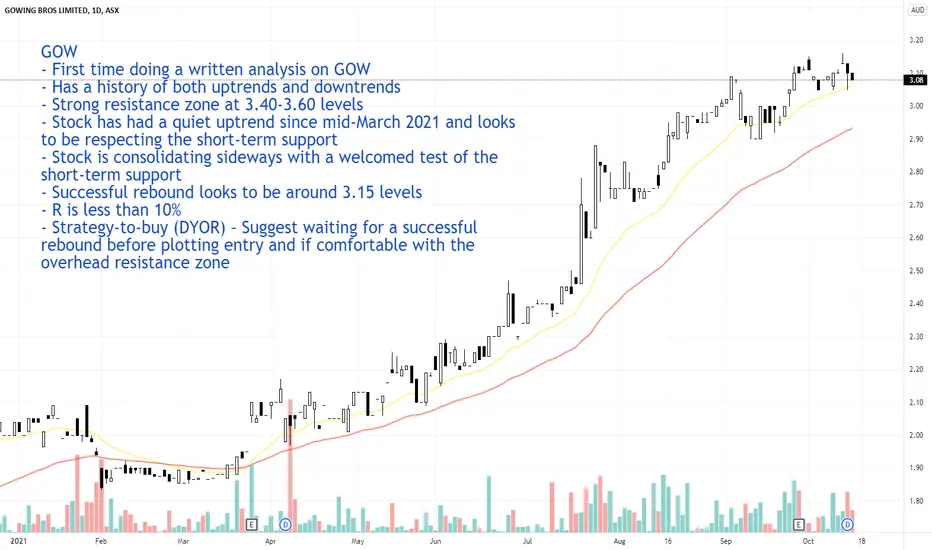
GOW
- First time doing a written analysis on GOW
- Has a history of both uptrends and downtrends
- Strong resistance zone at 3.40-3.60 levels
- Stock has had a quiet uptrend since mid-March 2021 and looks to be respecting the short-term supp
−0.07AUD
−5.29 MAUD
64.33 MAUD
20.39 M
About GOWING BROS LIMITED
Sector
Industry
CEO
John E. Gowing
Website
Headquarters
Coffs Harbour
Founded
1868
ISIN
AU000000GOW5
FIGI
BBG000BKD9Y1
Gowing Bros is an investment agency. They provide services that include retail property, development, and private and strategic equity investments. Their customers' inquiries are addressed through phone, email, and online applications.
Trade directly on the supercharts through our supported, fully-verified and user-reviewed brokers.


Frequently Asked Questions
The current price of GOW is 2.24 AUD — it has increased by 0.90% in the past 24 hours.
Depending on the exchange, the stock ticker may vary. For instance, on ASX exchange GOWING BROS LIMITED stocks are traded under the ticker GOW.
GOWING BROS LIMITED is going to release the next earnings report on Sep 26, 2024. Keep track of upcoming events with our Earnings Calendar.
GOW stock is 0.90% volatile and has beta coefficient of 0.26. Check out the list of the most volatile stocks — is GOWING BROS LIMITED there?
Yes, you can track GOWING BROS LIMITED financials in yearly and quarterly reports right on TradingView.
GOW stock has fallen by 2.18% compared to the previous week, the last month showed zero change in price, over the last year GOWING BROS LIMITED has showed a 16.73% decrease.
GOW net income for the last quarter is 2.40 M AUD, while the quarter before that showed −6.25 M AUD of net income which accounts for 138.37% change. Track more GOWING BROS LIMITED financial stats to get the full picture.
Like other stocks, GOW shares are traded on stock exchanges, e.g. Nasdaq, Nyse, Euronext, and the easiest way to buy them is through an online stock broker. To do this, you need to open an account and follow a broker's procedures, then start trading. You can trade GOWING BROS LIMITED stock right from TradingView charts — choose your broker and connect to your account.
Investing in stocks requires a comprehensive research: you should carefully study all the available data, e.g. company's financials, related news, and its technical analysis. So GOWING BROS LIMITED technincal analysis shows the buy rating today, and its 1 week rating is sell. Since market conditions are prone to changes, it's worth looking a bit further into the future — according to the 1 month rating GOWING BROS LIMITED stock shows the sell signal. See more of GOWING BROS LIMITED technicals for a more comprehensive analysis.
If you're still not sure, try looking for inspiration in our curated watchlists.
If you're still not sure, try looking for inspiration in our curated watchlists.
EBITDA measures a company's operating performance, its growth signifies an improvement in the efficiency of a company. GOWING BROS LIMITED EBITDA is 5.94 M AUD, and current EBITDA margin is 12.34%. See more stats in GOWING BROS LIMITED financial statements.