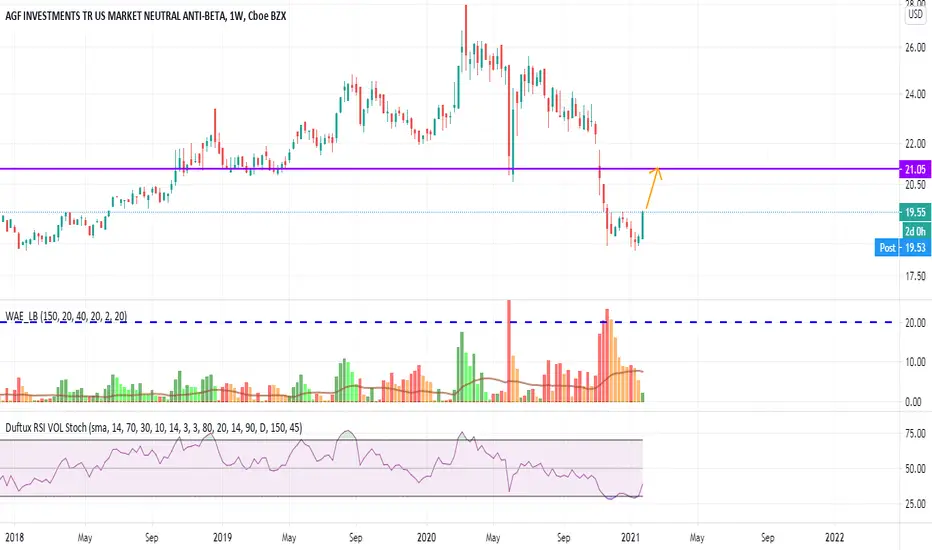
Hedge Fund Exposure vs The market .... Hedge Fund Exposure proxy BTAL etf vs The market as a whole ....
Key stats
About AGF U.S. Market Neutral Anti-Beta Fund
Expense ratio
1.43%
Home page
Inception date
Sep 13, 2011
BTAL actively manages its portfolio of stocks through a market neutral strategy. The fund targets the top 1,000 by market-cap, including REITs, in the Dow Jones U.S. Index. The fund`s market neutral approach aims to offset nominal long and short positions. BTAL ranks stocks in each sector by beta, and individual stocks get equal weight within their sectors. Overall, long low beta and short high beta might be expected to negatively correlate to equities despite the equal dollar offsetting exposure. While BTAL uses swaps at times, it typically takes direct short positions in stocks rather than relying solely on derivatives for short exposure. Therefore, the fund reports short interest costs in its expense ratio, something that purely swaps-based long-short funds don`t have to do, although short interest expense hits the bottom line in either case. Prior to Feb. 14, 2022, the fund tracked the Dow Jones U.S. Thematic Market Neutral Low Beta Index following the same strategies.
Classification
What's in the fund
Exposure type
Cash
Stocks−10.65%
Electronic Technology2.92%
Health Services2.32%
Energy Minerals2.05%
Consumer Services1.80%
Process Industries1.77%
Retail Trade1.39%
Communications1.11%
Utilities0.97%
Miscellaneous0.56%
Distribution Services−0.59%
Consumer Non-Durables−0.82%
Finance−1.48%
Consumer Durables−1.55%
Commercial Services−1.56%
Industrial Services−1.68%
Health Technology−2.69%
Transportation−3.06%
Non-Energy Minerals−3.42%
Producer Manufacturing−3.50%
Technology Services−5.18%
Bonds, Cash & Other110.65%
Cash110.65%

How I Became an Anti-Beta GigachadHigh beta stocks are terrible in a recession. This fund has no direct market exposure, but takes an aggressive position against high beta stocks. It will rise in recessionary conditions.

alternatives for the winCheck out BTAL as an option for an alternative allocation for your portfolio. CVSIX if you can access mutual funds, BTAL if you can't. Both are market neutrals. As we top out in the market, alternatives become more and more crucial to protecting your portfolio and furthering the gains.
*This is no

use BTAL as a form of protection and stability.BTAL combines a strategy of going long on low-beta stocks and shorting high-beta stocks. It is a market-neutral strategy that helps to balance a portfolio. A 5% position of your overall holdings in a market-neutral is a good rule of thumb.
It is a very simple and easy way to give your portfolio dow

See all ideas