I see 'Timeframe' and 'Wait for timeframe closes' options in an indicator's settings. What do they do?
Multi-timeframe analysis (MTF) is a process by which traders can view the same ticker/indicator at a higher timeframe than the chart’s. Traders use MTF to situate a chart’s price action in the broader, long-term context.
Many of our built-in indicators come with MTF functionality. When they do, the script's "Settings/Inputs" tab will contain the 'Multi Timeframe' section with a Timeframe dropdown, from where you can select the timeframe that you want this particular indicator to be calculated on. This allows you to look at, for example, a 1h chart and see the daily moving average at the same time.

The indicator's timeframe should ideally be higher than the chart's, to provide a broader perspective. Using timeframes lower than the chart's will produce fragmentary results, because for each bar on the chart, there will be several bars from the indicator's timeframe, and only the last intrabar's value will be displayed (multiple values cannot be displayed for a single chart bar).
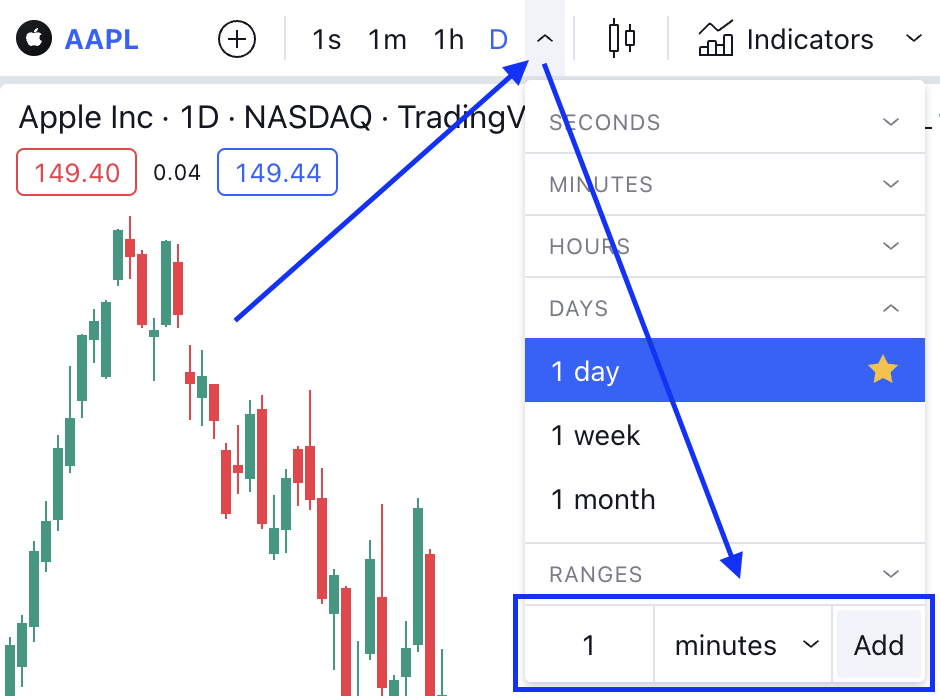
If you want to add new timeframes to the "Timeframe" dropdown, you can do this by adding them to the main "Time Interval" dropdown menu available on the chart page. The list of custom timeframes is shared between the two menus.
The 'Wait for timeframe closes' setting specifies the behavior when the indicator's timeframe is higher than the chart's. When 'Wait for timeframe closes' is checked, higher timeframe values only come in and are interconnected on the chart when the higher timeframe completes. For example, an indicator with "1 hour" as its timeframe displayed on a minute chart will only return a value once in 60 bars, i.e., when the hourly bar closes and the value is confirmed. This has the advantage of avoiding repainting in real-time. The values will be visually connected by a line, but no data will be actually present between them.
If 'Wait for timeframe closes' is unchecked, historical gaps are filled with the last returned value. On real-time bars, the last available value will be returned on every tick, allowing you to track the real-time development of the indicator's values. With this setting enabled, the indicator will produce non-repainting values on historical bars, but repainting values in real time.
If you want to enable the MTF functionality for your custom Pine indicator, see this Help Center article to learn more.