Extended Line
Application
Extended Line drawing tool allows you to place a line on your chart which extends indefinitely in any direction. It can be used to create your own trend line or trend channel. The key feature is that it extends indefinitely. This means that no matter how far into the future or past you move the chart, the line will still be visible, extending at the same angle as its origin.
Style
In Style property dialog it is possible to change the appearance of an Extended Line:
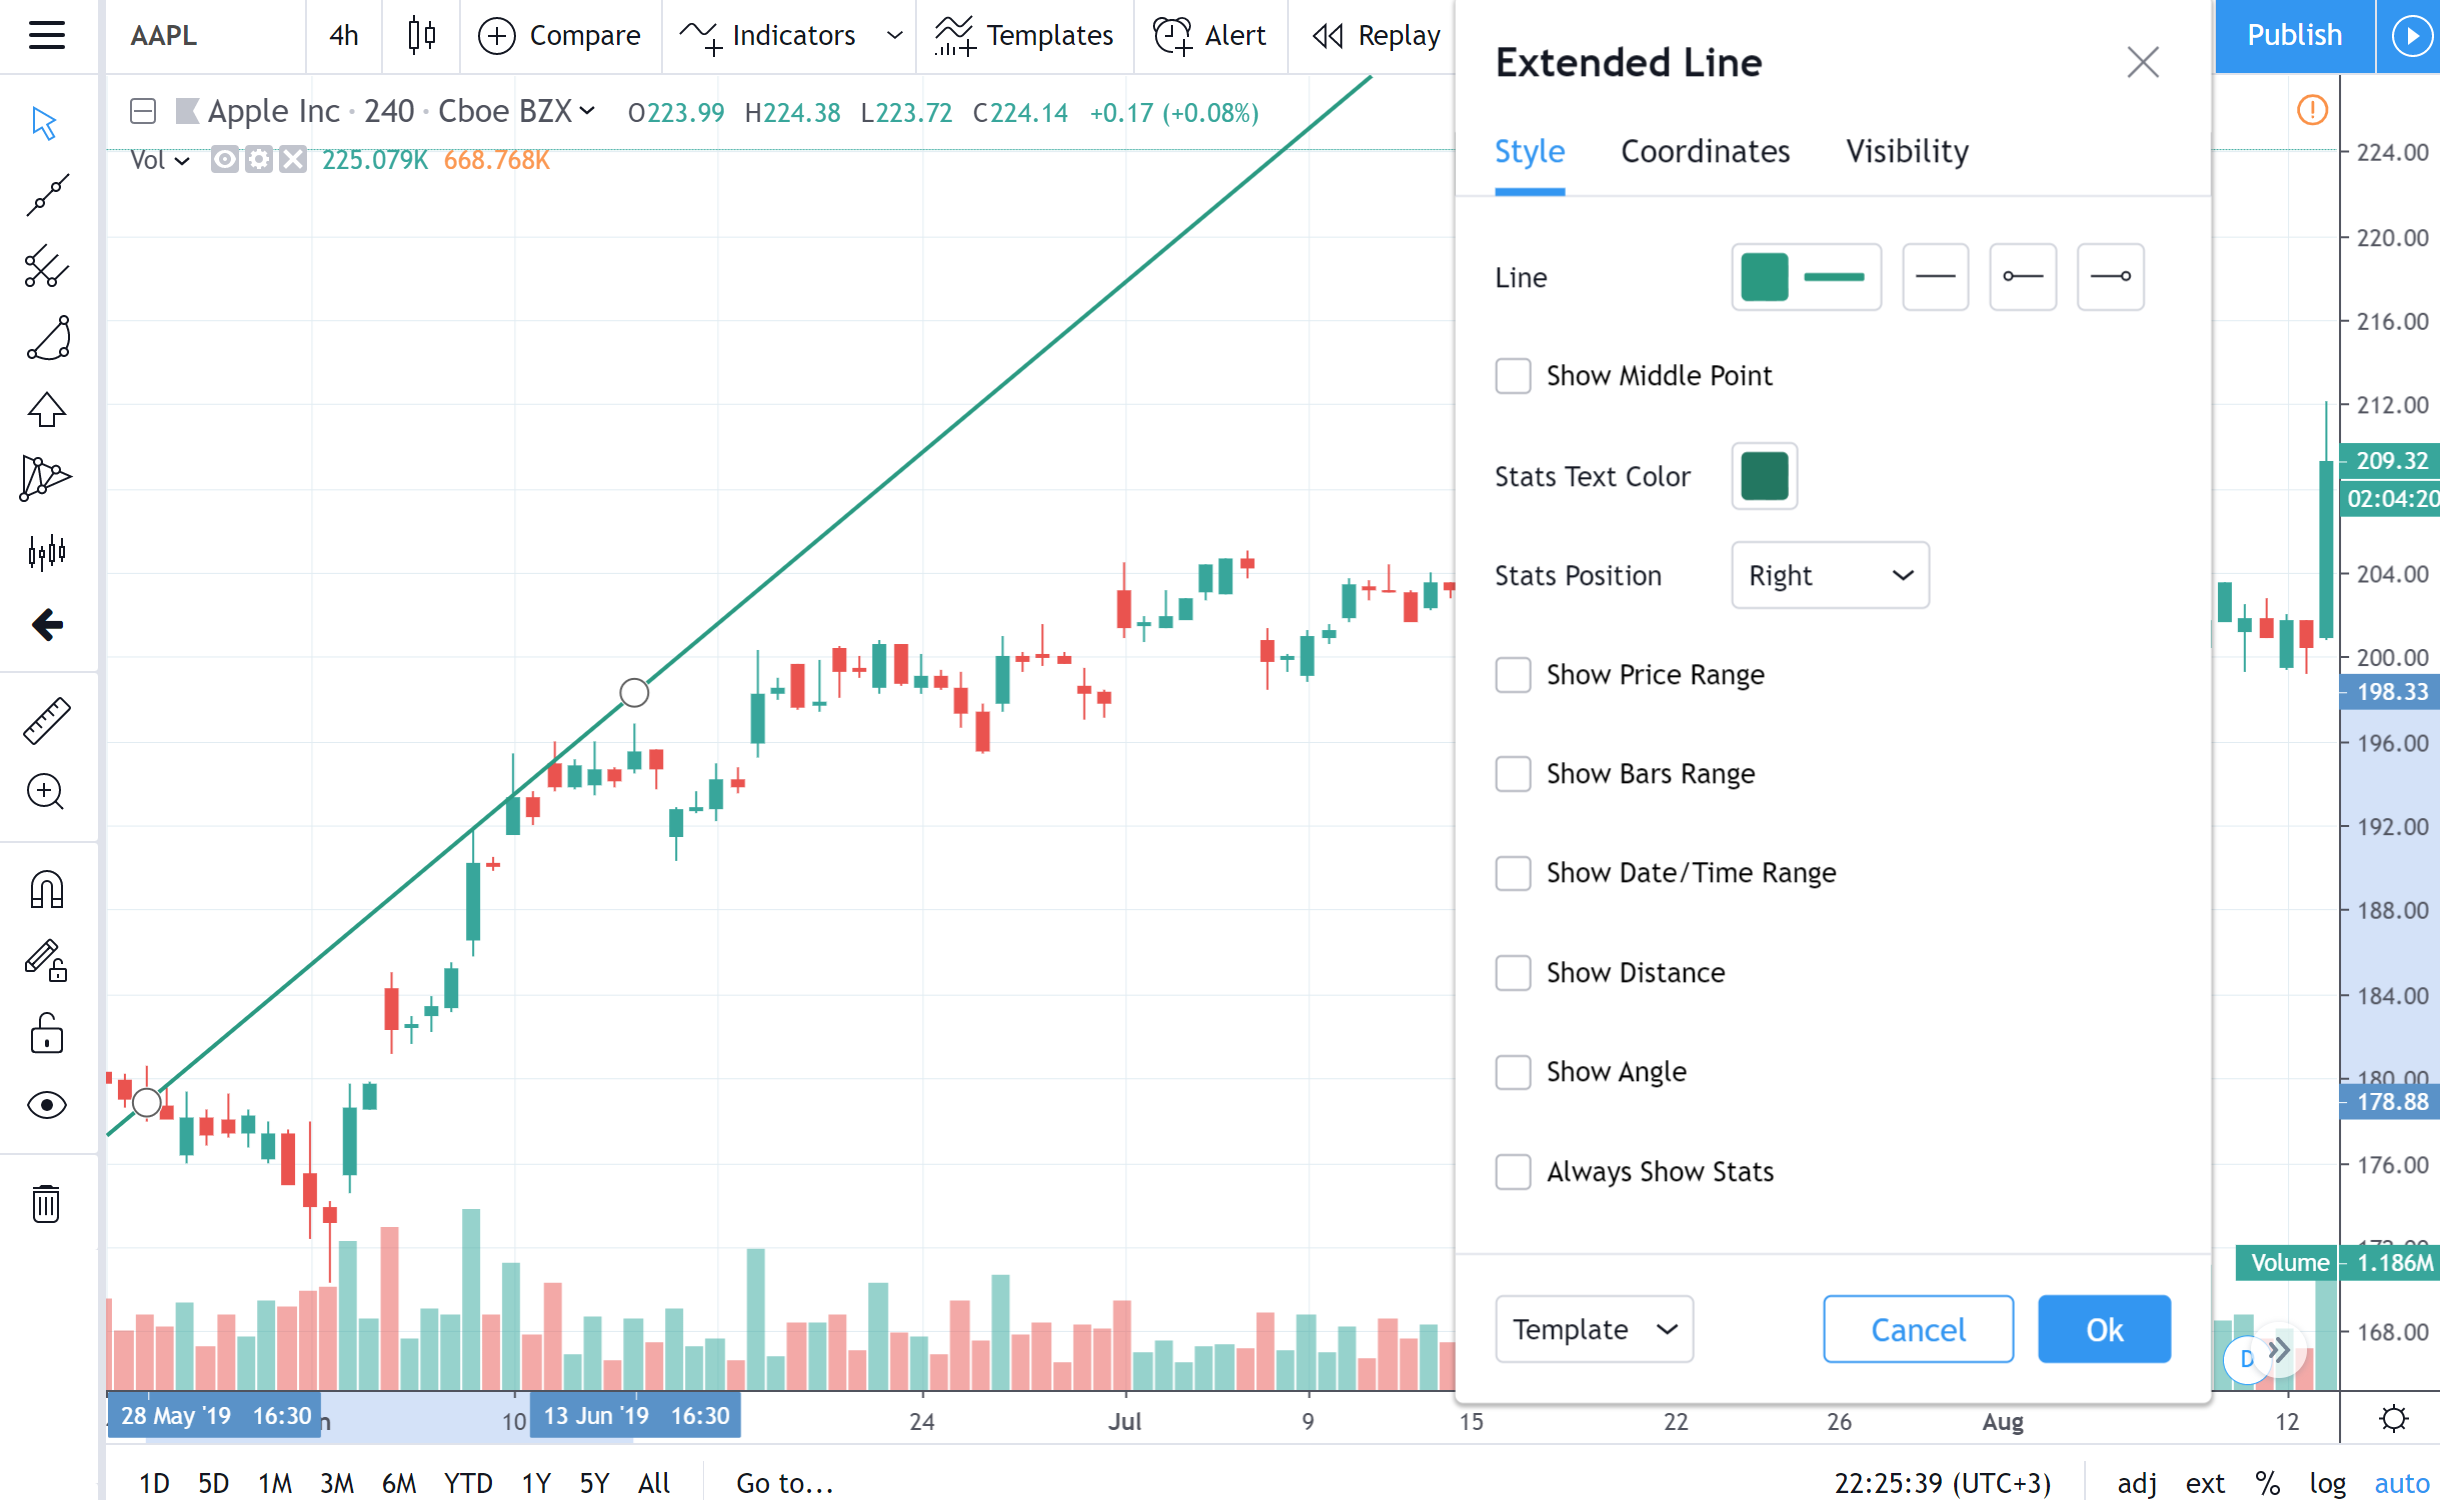
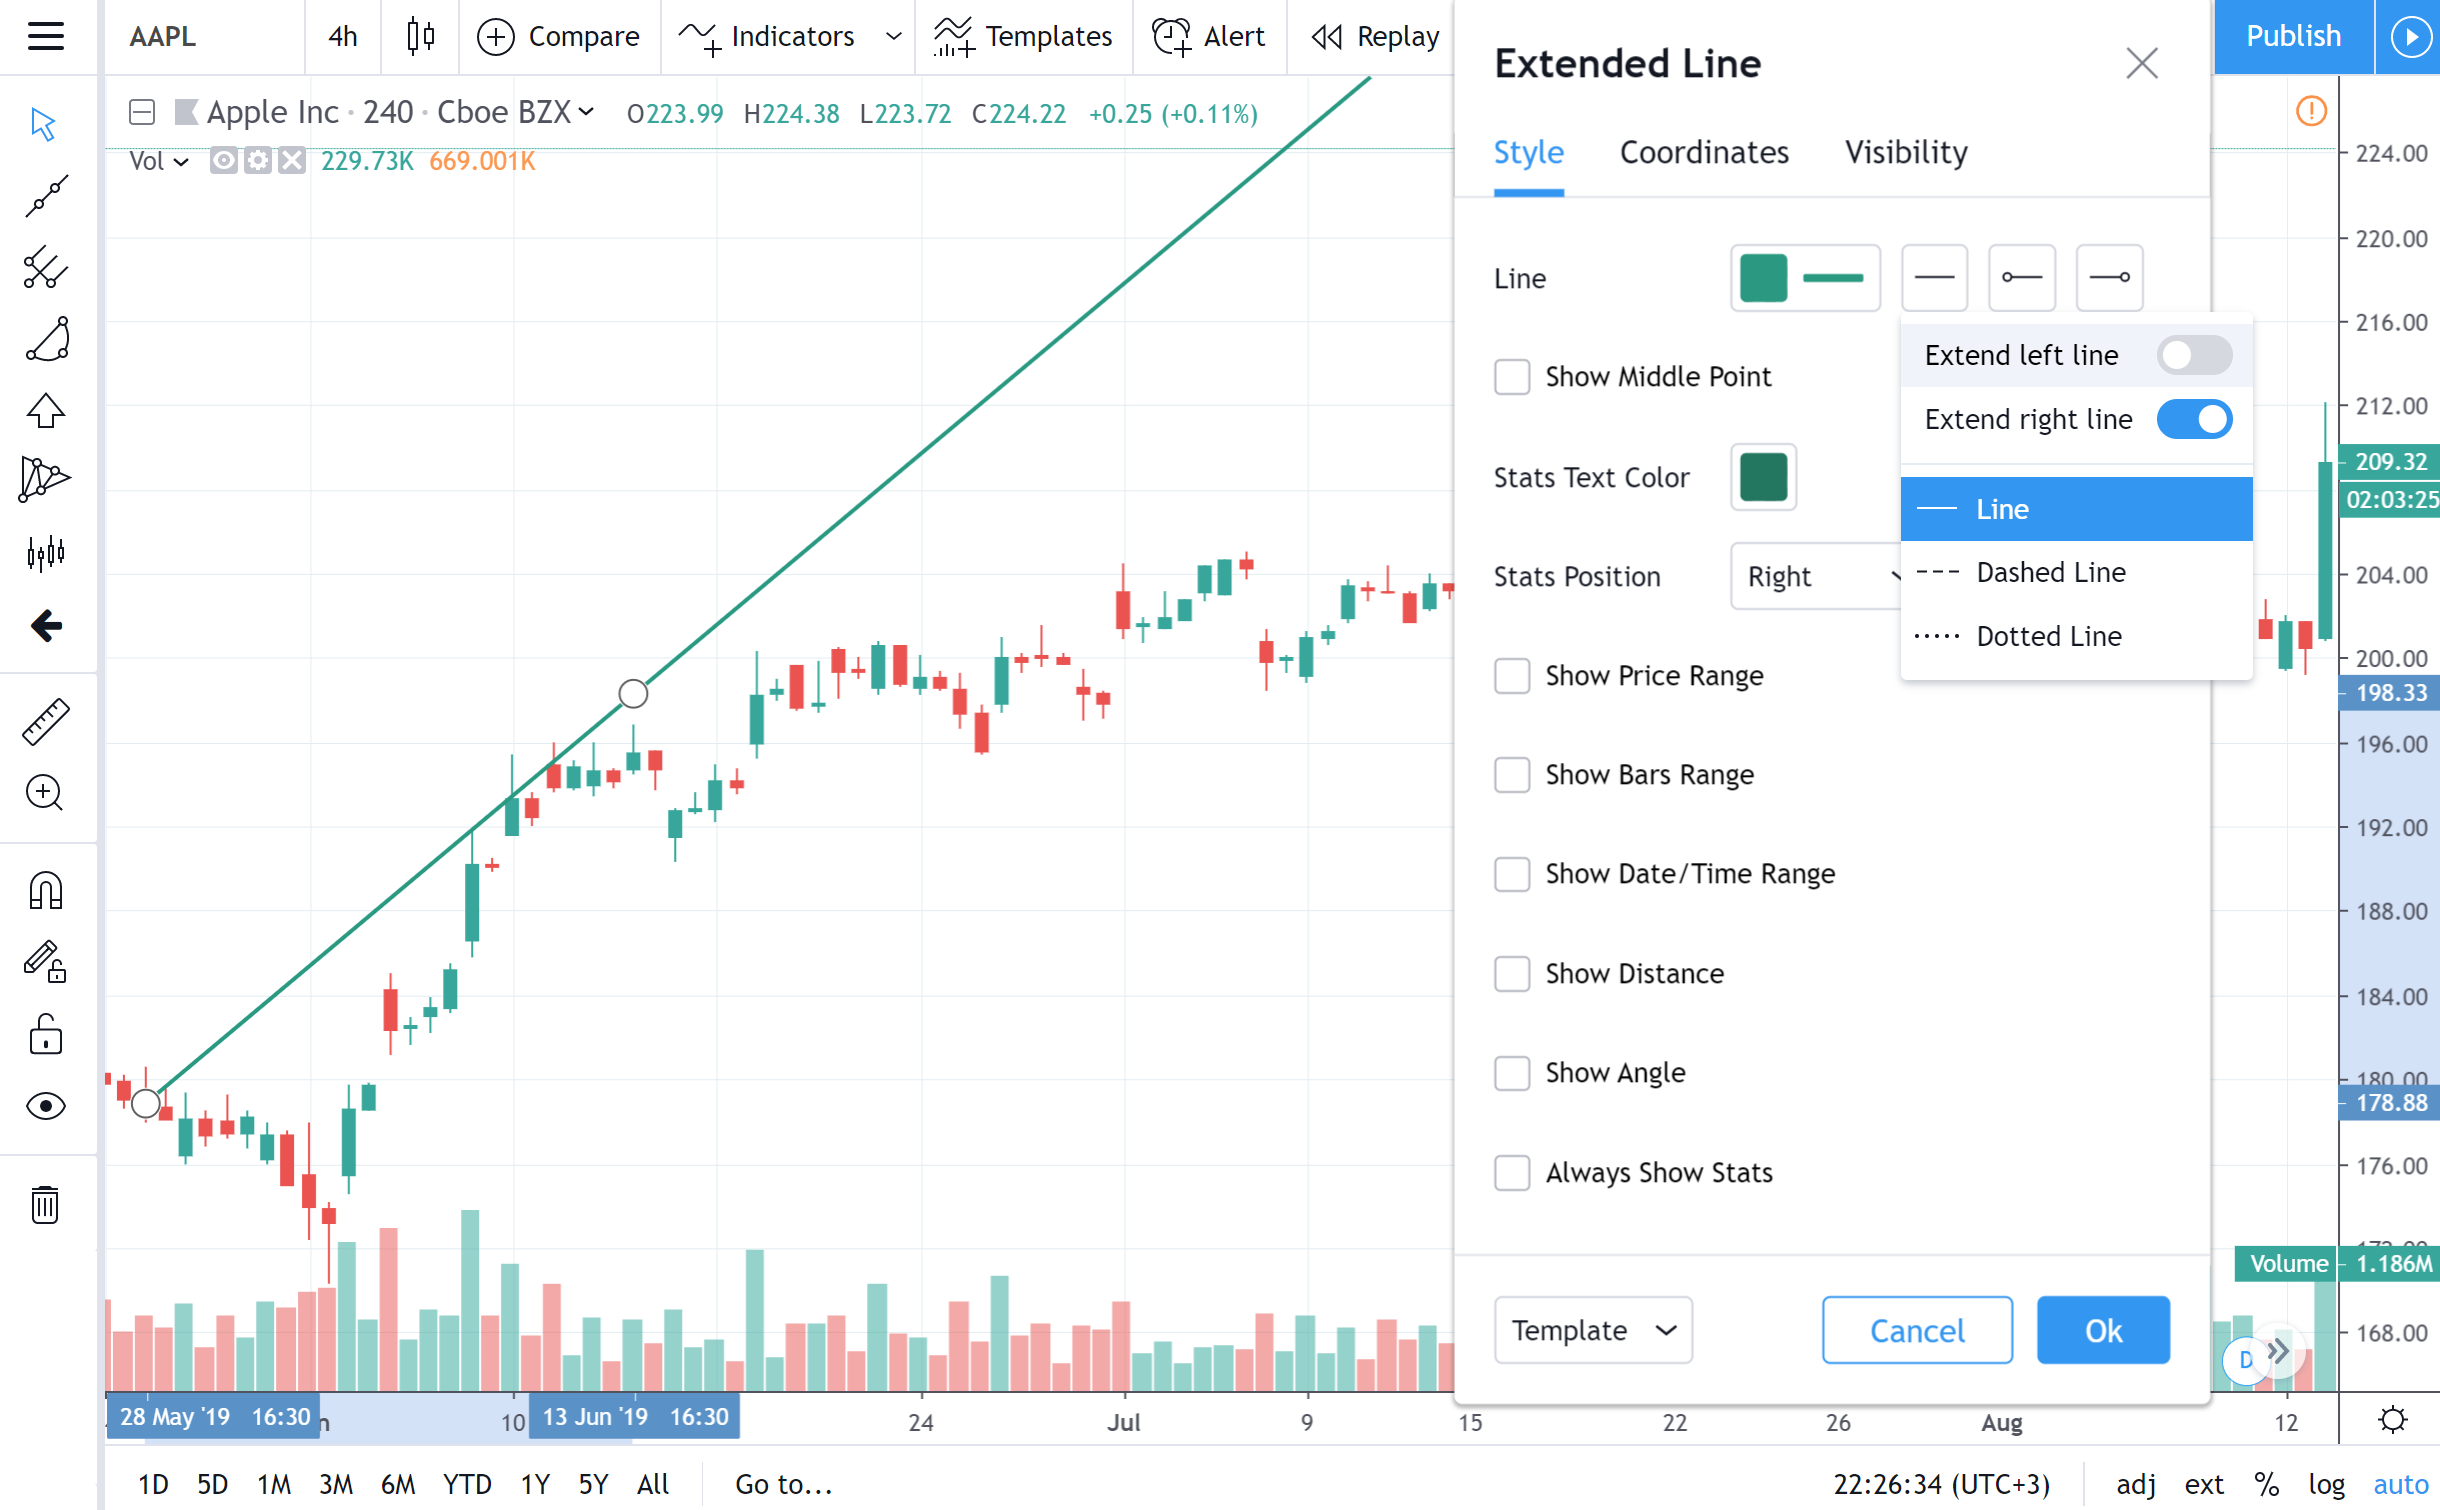
Line
Sets the color, opacity, thickness and style of an extended line. The second drop-down menu contains options of setting the line style and extending one or both line's ends to infinity.
Also, in the last two drop-downs of Line, an arrow-shaped end may be set instead of a normal one for the left and right ends of the extended line. To make the line's end visible, switch off its extending by slider.
Show Middle Point
Toggles the visibility of the extended line's mid-point.
Text
Checkboxes Show Price Range, Bars Range, Date/Time Range, Show Distance, Show Angle allow to display the text with the relevant information beside the Extended Line on a chart.
Stats Text Color drop-down menu allows to change the color, font type and font size for this text.
Position for this text is to be selected in Stats Position drop-down menu.
Show Price Range
Toggles the visibility of text displaying the price range between the extended line's two points.
Show Bars Range
Toggles the visibility of text displaying the number of bars between the extended line's two points.
Show Date/Time Range
Toggles the visibility of text displaying the date/time range between the extended line's two points.
Show Distance
Toggles the visibility of text displaying the specific distance (in terms of periods) between the extended line's two points.
Show Angle
Toggles the visibility of text displaying the inclination angle of the extended line (in degrees).
Always Show Stats
If this checkbox is not selected, Stats Text will appear beside only when the Extended Line is selected by mouse click.
Coordinates
In Coordinates properties dialog you can set precisely the position of the Extended Line's end points on the price scale (by setting the price) and the time scale (by setting the bar number):

Price 1
Allows for the precise placement of the extended line's first point (Price 1) using a bar number and price.
Price 2
Allows for the precise placement of the extended line's second point (Price 2) using a bar number and price.
Visibility
In visibility properties dialog you can switch the Price label tool displaying on charts of different timeframes:

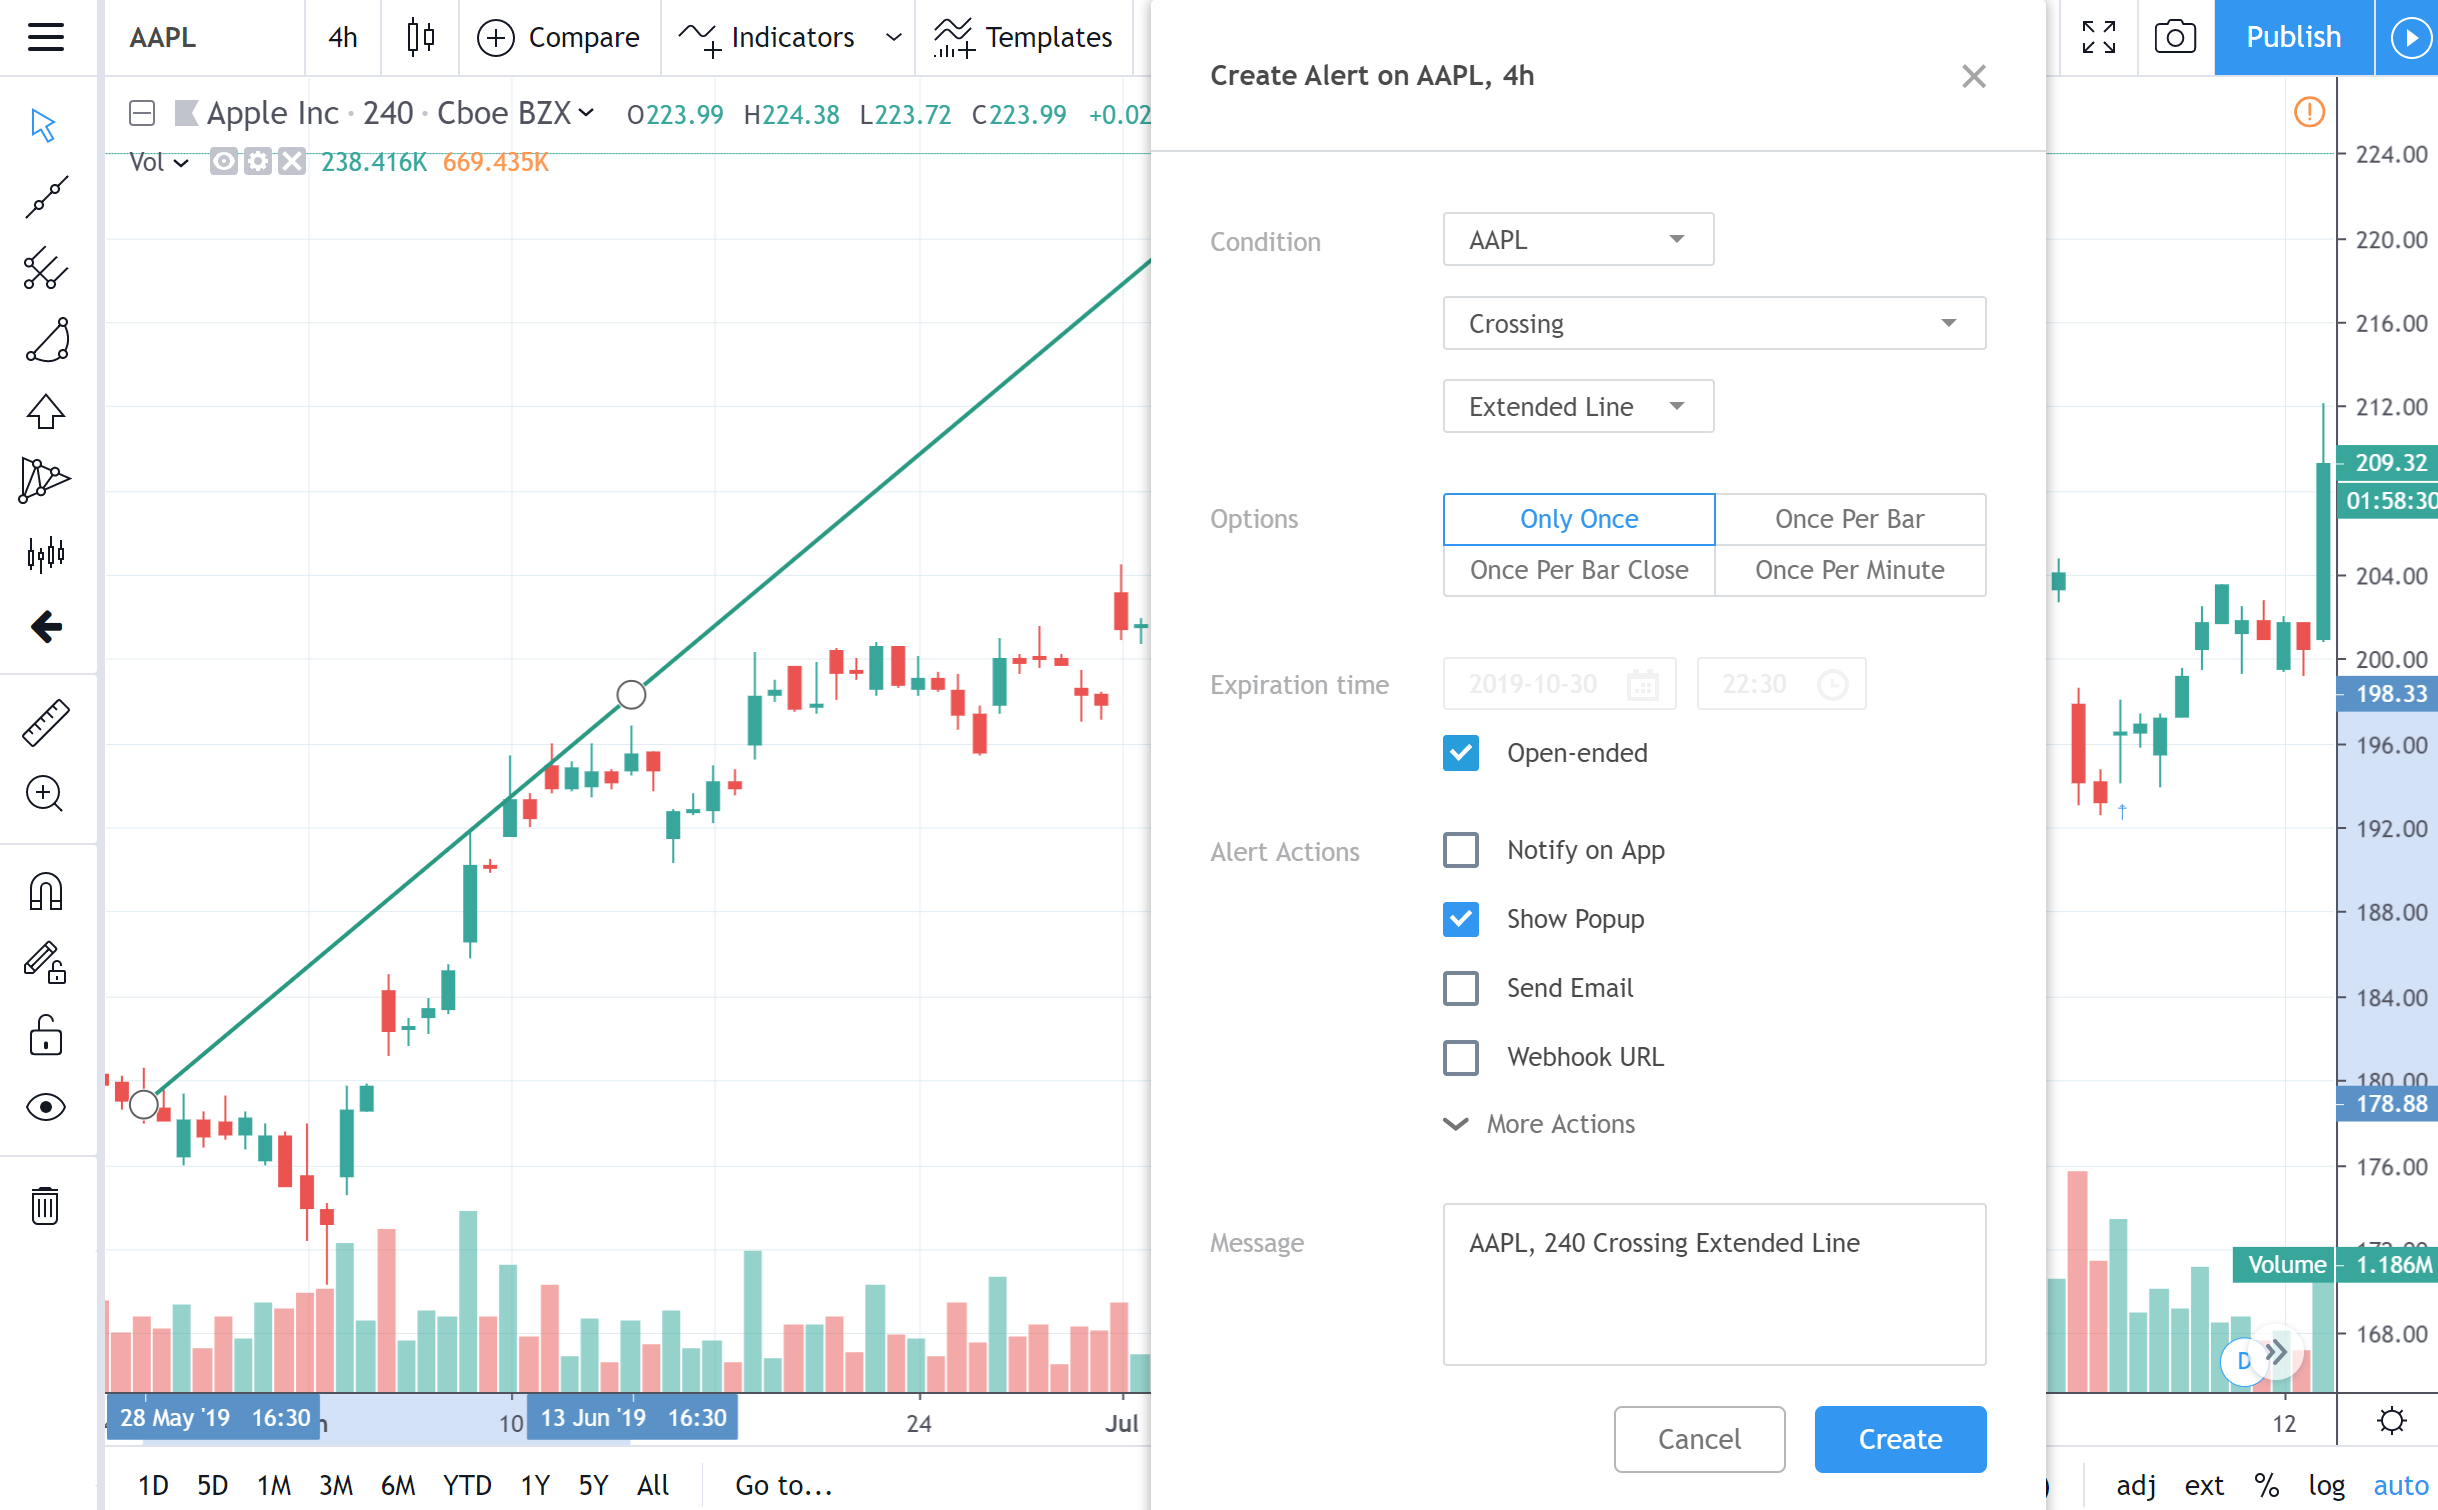
Alert
It is possible to set an alert to get notified about a series crossed the Extended Line on a chart. Use the clock icon in floating drawing toolbar or in right click menu on the Extended Line itself:

Then select a condition, periodicity and preferable method of notification, edit the notification massage if you wish and press Create: