Zigzag
Indicators, Strategies and Libraries
I spent a lot of time searching for the best ZigZag indicator. Difficulty with all of them is that they are always betting on some pre-defined rules which identify or confirm pivot points. Usually it is time factor - pivot point gets confirmed after a particular number of candles. This methodology is probably the best when market is moving relatively slow, but...
Hello Traders, For a few months I have been getting requests from my followers about ABC pattern and finally I decided to make this indicator. How it works? - It creates Trend Cloud using Simple and Exponential moving averages with the lenghts 50, 100, 150, 200, 20, 40 by default and checks the trend. you can change the lengths as you wish - It also creates...
Here is an attempt calculate Average Zigzag Range (AZR). This can be used similar to ATR. Using AZR instead of ATR for trailing stop calculation may yield better outcome in trend trading. Logic is simple. Calculate zigzag based on ZigzagLength Calculate distance between each zigzag pivots Calculate simple moving average of last MALength pivots Use ...
This is Bollinger Band built on top of Zigzags instead of regular price + something more. Indicator presents 7 lines and cloud around it. This can be used to visualize how low or high price is with respect to its past movement. Middle line is moving average of last N zigzag pivots Lines adjacent to moving average are also moving averages. But, they are...
What is it? This is an indicator to complement @modhelius' Weis Wave Volume Indicator. Original code has been modified to display wave volume (cumulative) numbers above or below the latest candle of the corresponding wave on the main pane. Since we are concerned only with relative volume, VOLUME NUMBERS HAVE BEEN SCALED DOWN. (If you need actual volume numbers,...
Lets dabble a bit into Elliot Waves. This is a simple script which tries to identify Wave 1 and 2 of Elliot Impulese Wave and then projects for Wave 3. Ratios are taken from below link: elliottwave-forecast.com - Section 3.1 Impulse Wave 2 is 50%, 61.8%, 76.4%, or 85.4% of wave 1 - used for identifying the pattern. Wave 3 is 161.8%, 200%, 261.8%, or...
Hi fellow traders.. Happy to share a Linear Regression & RSI Multi-Function Custom Screener with Table-Labels... The Screener scans for Linear Regression 2-SD Breakouts and RSI OB/OS levels for the coded tickers and gives Summary alerts Uses Tables (dynamica resizing) for the scanner output instead of standard labels! This Screener cum indicator collection has...
Fibonacci time zones, based on the Fibonacci number sequence, are vertical lines that represent potential areas where a swing high, low, or reversal could occur. Trend-Based Fib Time shows probable price corrections in an existing trend. A useful tool to use in addition to Elliot Wave counting, Fib Time helps to identify how far the wave is likely to travel ...
The Zig Zag indicator is a useful indicator when it comes to visualizing past underlying trends in the price and can make the process of using drawing tools easier. The indicator consists of a series of lines connecting points where the price deviates more than a specific percentage from a maximum/minimum point ultimately connecting local peaks and troughs. This...
This is standard zigzag indicator. I just coded them using lines array feature of pine - so that it can be done in least number of lines of code. Few possible improvements: Use label array to mark HH, HL, LH and LL Add standard deviation check
How to detect the current "market beat" or market cycle? A common way to capture the current dominant cycle length is to detrend the price and look for common rhythms in the detrended series. A common approach is to use a Detrended Price Oscillator (DPO). This is done in order to identify and isolate short-term cycles. A basic DPO description can be found...
Overview, Features, and Usage: The Zig Lines with Percent & Value is an indicator that highlights the highest and lowest points of the market from pivot points and zigzag lines based on the ZigZag Period setting. By a default value of 13 for the ZigZag Period this works well on Bitcoin or other alt coins on the 1 hour or higher timeframe charts. What makes this...
This script uses the Average Direction Index, On Balance Volume, and Exponential Moving Average, Moving Average Cross, MACD, Donchian Channels and two Parabolic SARs for stop loss, a normal one and a line one. I tried to make the script as straightforward as possible, Buy when there is a buy signal and sell when there is a sell signal. I like using it on the...
Hello All, Today I am here with a new idea and script, " LTB Zigzag Circles ". The idea is to create Circles using last 2 zigzag waves and to catch the breakouts earlier than horizontal lines. if a circle is broken then the script shows entry for Long/Short positions. and if broken circle reappears again then the position is closed. You can change Zigzag period...
Aᴜᴛᴏ PɪᴛᴄʜFᴀɴ, Fɪʙ Exᴛᴇɴꜱɪᴏɴ/Rᴇᴛʀᴀᴄᴇᴍᴇɴᴛ ᴀɴᴅ ZɪɢZᴀɢ This study aim to automate PitchFan drawing tool and combines it with Fibonacci Extentions/Retracements and ZigZag. Common setting options, applied to all components of the study Deviation , is a multiplier that affects how much the price should deviate from the previous pivot in order for the bar to...
Fɪʙᴏɴᴀᴄᴄɪ Exᴛᴇɴᴛɪᴏɴ / Rᴇᴛʀᴀᴄᴍᴇɴᴛ / Pɪᴠᴏᴛ Pᴏɪɴᴛꜱ This study combines various Fibonacci concepts into one, and some basic volume and volatility indications █ Pɪᴠᴏᴛ Pᴏɪɴᴛꜱ — is a technical indicator that is used to determine the levels at which price may face support or resistance. The Pivot Points indicator consists of a pivot point (PP) level and several...
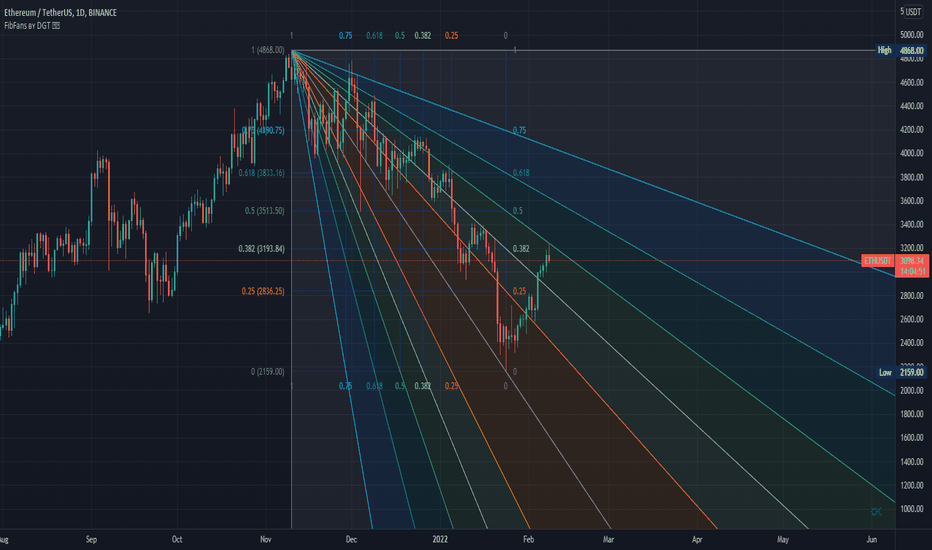
Fibonacci Speed and Resistance Fan is an analytical drawing tool used to indicate the support and resistance levels of an existing trend and the price level at which possible changes in the trend may occur. A Fibonacci Speed Resistance Fan consists of a trend line drawn between two extreme points - a trough and opposing peak or a peak and opposing trough - on...
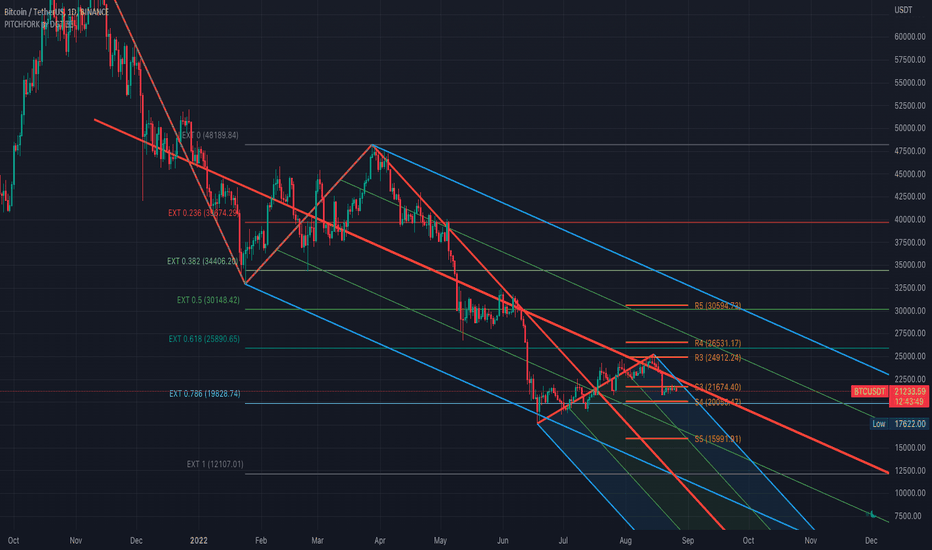
Pitchfork is a technical indicator for a quick and easy way for traders to identify possible levels of support and resistance of an asset's price. It is presents and based on the idea that the market is geometric and cyclical in nature Developed by Alan Andrews, so sometimes called Andrews’ Pitchfork It is created by placing three points at the end of...


![Zig Zag Channels [LuxAlgo] BTCUSD: Zig Zag Channels [LuxAlgo]](https://s3.tradingview.com/a/a2PJSO1p_mid.png)


