Indicators, Strategies and Libraries
The Market Mode indicator seeks to identify trends and rebounds by identifying “phases” according to the principles of John Ehlers. - When the oscillator passes above the top line, the market is in an uptrend. - When the oscillator goes below the bottom line, the market is in a downtrend. - Between these two levels, the market is calmer and could rebound in the...
I add a basic strategy for the "Quadratic traffic light" indicator, it can help to find a good configuration. Regards.
The quadratic semaphore indicator is an indicator that find confirmed market u-turn with the help of 2 quadratic regression calculated with Highs and Lows over the last “length” periods. - “p” setting is candlesticks quantity to confirmed the quadratic regression has formed a High or Low parabola, such as Fractals. Consecutive same signals can happen due to the...
This script detects an event created by Oliver Velez, it is a wide-range candle with a small body and a long tail (hammer-type candle), its range is noticeably larger than previous candles, as a rule it can be taken that the body should be maximum of 30% of the total range of the candle with a long tail. The stop goes under the tail and the signal is given when...
The Dynamic RSI indicator is a kind of exponential RSI. The overbought and oversold levels (respectively HiLine and LoLine) are calculated according to the recent highest and lowest values of the Dynamic RSI line.
The TMMS oscillator (aka “Trading Made More Simpler”) is an indicator made of conditions based on both 2 separated Stochastic and 1 RSI. Bullish zone is green and bearish one is red. When the histogram is grey, no signals is available at that time. The indicator has an option to show the current trend of an Hull moving average (ascending or descending curve)....
Find golden and silver crosses with using EMA. Note Colors are depends on you. Translation AL = BUY SAT = SELL ONAY = CONFIRMATION
This source code is subject to the terms of the Mozilla Public License 2.0 at mozilla.org © 03.freeman This strategy is based only on T3 moving average, but uses sma 200 as filter for enter long or short. The default settings considers a daily timeframe. The strategy is very simple: long if T3 increase, short if T3 decrease. Note that if you set volume factor...
Only longs when Macd line is above Bollinger Band and shorts when Macd line is above Bollinger Band, this will avoid many problems. thumbs up!!!
- Climate volume detection - Relative volume value in bar - Automatic zone generation (possibility of configuration) - Additional features ¡¡¡Thumbs up¡¡¡
This script detects an event created by Oliver Velez, basically it is a wide-range candle, its range is noticeably larger than the previous candles, this event indicates a possible continuation of the movement, or the beginning of an extended movement. The candle has to be of good body, as a rule it can be taken that the body must be more than 70%. The stop goes...
This is a simple study that combines MFI and RSI and provides buy/sell alerts. The red lines are MFI. the blue lines are RSI. Boundries are colored as the indicators and are user configurable. Black triabgles are buy/sell points when both MFI and RSI are overbought/sold.
The Market Thrust indicator is a powerful measure of the stock market's internal strength or weakness. There are four components to this indicator: 1-Advancing Issues on the New York Stock Exchange (NYSE) – $ADV 2-Advancing Volume on the NYSE – $UVOL 3-Declining Issues on the NYSE – $DECL 4-Declining Volume on the NYSE – $DVOL The formula for Market Thrust is...
Leledc Exhaustion Bar indicator created by glaz converted to Pine 4, plotshape was added.
Indicator for strategy that was used in a Forex competition and was a winner. Use double MACD with custom settings, search video on YouTube: Learn Five Powerful MACD Trading Strategies Add some tools to analyze the market context a little more: - Detector of regular and hidden divergences. - Atlas Zone (detects consolidation that is about to generate a...
THIS INDICATOR DETERMINES WHAT THE STRONG HANDS AND WEAK HANDS ARE DOING, BASED ON THE FAMOUS INDICATOR "KONCORDE", OBTAINED FROM THE PERCENTARY VARIATION OF THE INDICATOR IVP (POSITIVE VOLUME INDEX) AND IVN (VOLUME INDEX). ANYONE READING THE AVAILABLE DOCUMENTATION ON THESE TWO SMALL MATHEMATICAL JEWELRY WILL DISCOVER THAT THE ATTRIBUTED VOLUMES NEGOTIATED TO...
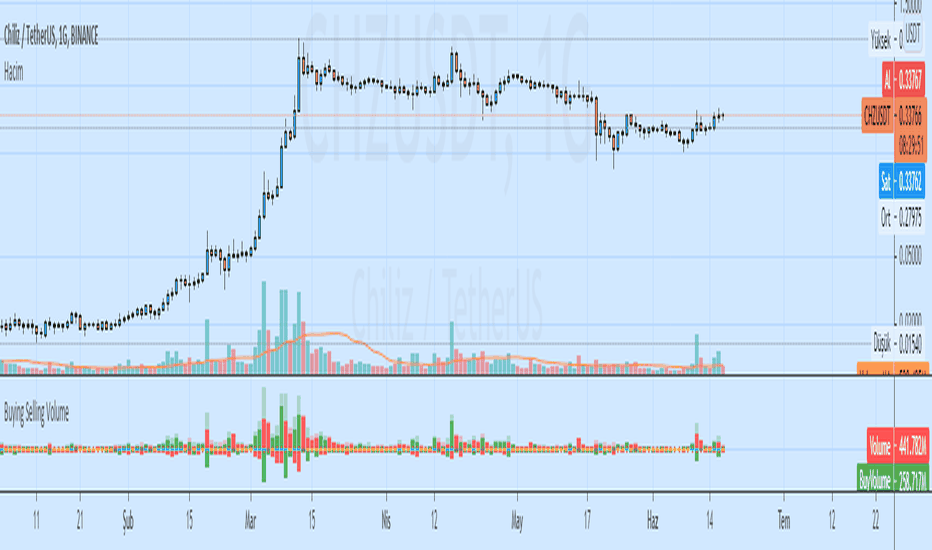
Buying Selling Volume -Buy Volume -Sell Volume -Buy Volume Percent % -Sell Volume Percent % -Volume Index -Buy Sell Volume- BuyVolume>SellVolume=Blue barcolor SellVolume>BuyVolume=Purple barcolor -Volume Index- VolumeIndex>length and close > open =Cyan barcolor VolumeIndex>length and close < open =Gray barcolor VolumeIndex<=length = Yellow barcolor


